EUR/USD Current price: 1.1012
View Live Chart for the EUR/USD
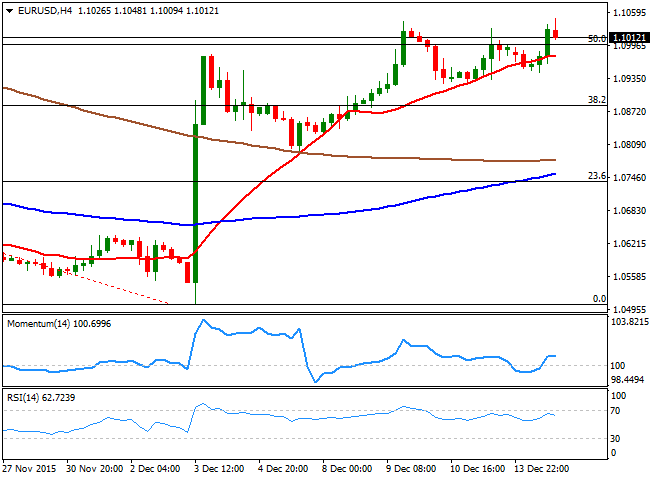
The EUR/USD pair advanced up to 1.1048 during the American afternoon, as once again, the dollar got under selling pressure following Wall Street's opening. The common currency fluctuated within minor gains and losses ever since the day started, mostly led by stocks' movements, as little macroeconomic data hit the wires. Early in the morning, the EU industrial production was up by 0.6% in October, compared to a month before, and increased by 1.09% yearly basis. There was no news coming from the US, but treasury yields are higher, partially recovering their latest losses and ahead of the FED economic policy decision this Wednesday.
While not solid, the EUR/USD pair continues to be biased higher, as the pair remains near the fresh 1-month high above mentioned. Short term, the 1 hour chart presents a positive tone, as the technical indicators stand above their mid-lines, albeit lacking directional strength. In the 4 hours chart, the pair managed to advance beyond a bullish 20 SMA, while the technical indicators have lost their upward strength in positive territory. More relevant, the pair is now above the 50% retracement of the October high/December low decline at 1.1000, an immediate short term support for the upcoming hours.
Support levels: 1.1000 1.0950 1.0910
Resistance levels: 1.1045 1.1080 1.1120
EUR/JPY Current price: 132.97
View Live Chart for the EUR/JPY
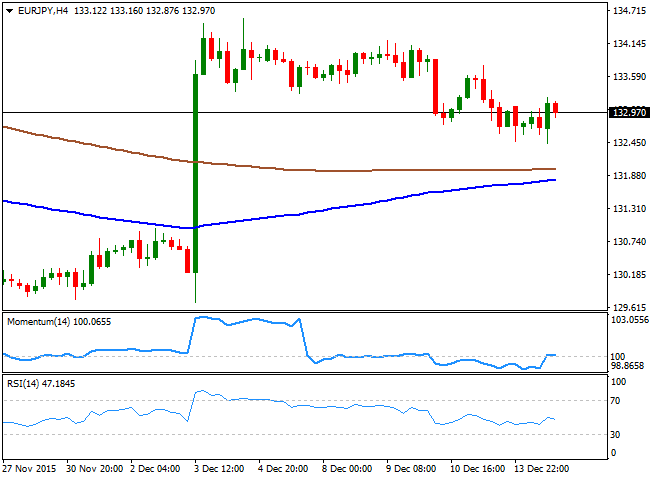
The EUR/JPY closes the day pretty much unchanged, a handful of pips below the 133.00 level, having extended its decline to a fresh 2-week low of 132.43, following the release of a strong Tankan manufacturing report in Japan, but yen gains were short lived, and EUR demand led the way during the second half of the day. The pair, however, has lost the strong bearish picture, at least in the short term, as in the 1 hour chart the technical indicators have managed to recover above their mid-lines, with the Momentum still flat, but the RSI heading higher around 54. In the same chart, the 100 and 200 SMAs stand a handful of pips above the current level, acting as dynamic resistance, with the shortest at 133.40. In the 4 hours chart, the pair held well above its moving averages, but the technical indicators maintain a neutral stance, flat around their mid-lines.
Support levels: 132.55 132.10 131.70
Resistance levels: 133.40 133.75 134.20
GBP/USD Current price: 1.5137
View Live Chart for the GPB/USD
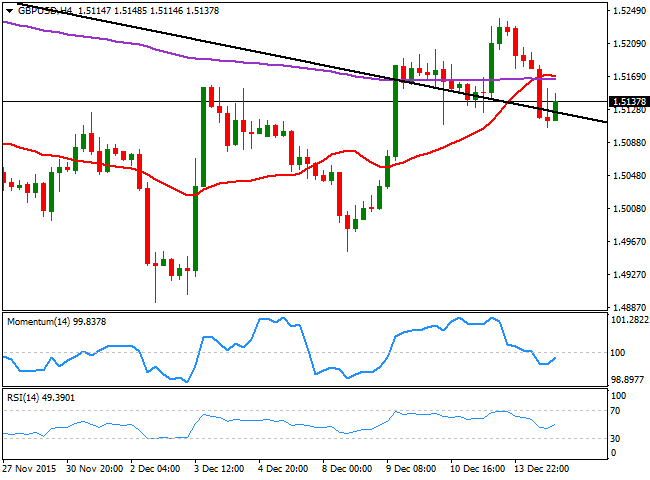
The GBP/USD pair fell down to 1.5106 during the European morning, finally capitulating to oil's decline, as the black gold extended its decline down to fresh 7-year lows. The economic calendar will be quite busy in the UK this Tuesday, with the release of inflation data for November, including CPI figures, Retail Price Index and PPI. Inflation is expected to have fallen again into negative territory, which may send the Pound even lower against all of its rivals. Technically speaking and for the short term, the risk remains towards the downside, as in the 1 hour chart, the price is developing below a bearish 20 SMA, while the technical indicators turned south below their mid-lines, after recovering from oversold territory. In the 4 hours chart, the upside seems limited as the pair is now below the 20 SMA and the 200 EMA, both around 1.5165, while the technical indicators aim higher, but remain below their mid-lines.
Support levels: 1.5090 1.5050 1.5010
Resistance levels: 1.5165 1.5200 1.5240
USD/JPY Current price: 120.68
View Live Chart for the USD/JPY
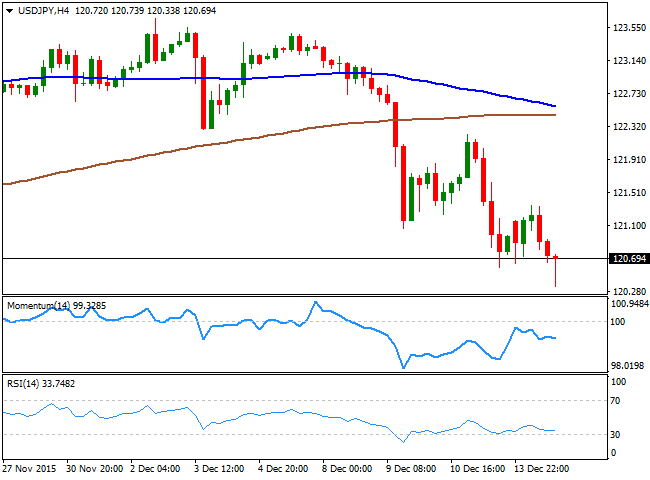
The USD/JPY plummeted to a fresh low of 120.33 during the US session, weighed by dollar's sell-off and the negative tone in socks. Additionally, the Japanese currency gained on the release of better-than-expected manufacturing local data, as the Tankan index beat expectations. The pair retains its negative tone in the short term, as in the 1 hour chart, the price remains well below a bearish 100 SMA, currently in the 121.70 region, and accelerating below the 200 SMA, whilst the technical indicators are turning south well below their mid-lines. In the 4 hours chart, the pair is also far below the moving averages, while the Momentum indicator heads south below its 100 line and the RSI lacks clear directional strength near oversold territory. With the FED economic policy decision looming, however, the pair will likely trade in a limited range this Tuesday, with approaches to the 120.00 level probably attracting some buying interest.
Support levels: 120.60 120.30 120.00
Resistance levels: 121.00 121.35 121.70
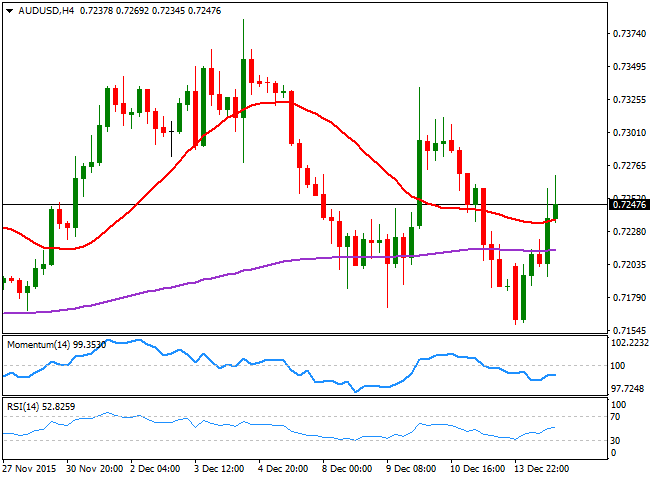
AUD/USD Current price: 0.7248
View Live Chart for the AUD/USD
The AUD/USD pair jumped to a daily high of 0.7269 on dollar's weakness during the second half of the day, helped by a recovery in commodities' prices. The pair recovered from a 2-week low of 0.7159 scored during the Asian session, and has erased most of its Friday's losses, holding above the critical 0.7240 level ahead of the Asian opening. The pair presents a strong bullish bias in the short term, as in the 1 hour chart, the price heads higher above a bullish 20 SMA, whilst the technical indicators present limited upward slopes near oversold levels. In the 4 hours chart, the price recovered above the 200 EMA after a brief decline below it, and is also above a now mild bullish 20 SMA, while the technical indicators aim higher, but below their mid-lines. Dips down to 0.7200 should now attract buyers to keep the bullish trend in place, and favor additional gains up to 0.7335 for this Tuesday.
Support levels: 0.7240 0.7200 0.7170
Resistance levels: 0.7285 0.7335 0.7380
-------
What will 2016 bring to the Forex traders? Attend our event, Forex Forecast 2016 - The Panel with Ashraf Laidi, Valeria Bednarik, Boris Schlossberg, Adam Button, Ivan Delgado and Dale Pinkert. Register for the live event on Dec. 18th and get the recording too.
-------
Information on these pages contains forward-looking statements that involve risks and uncertainties. Markets and instruments profiled on this page are for informational purposes only and should not in any way come across as a recommendation to buy or sell in these assets. You should do your own thorough research before making any investment decisions. FXStreet does not in any way guarantee that this information is free from mistakes, errors, or material misstatements. It also does not guarantee that this information is of a timely nature. Investing in Open Markets involves a great deal of risk, including the loss of all or a portion of your investment, as well as emotional distress. All risks, losses and costs associated with investing, including total loss of principal, are your responsibility. The views and opinions expressed in this article are those of the authors and do not necessarily reflect the official policy or position of FXStreet nor its advertisers. The author will not be held responsible for information that is found at the end of links posted on this page.
If not otherwise explicitly mentioned in the body of the article, at the time of writing, the author has no position in any stock mentioned in this article and no business relationship with any company mentioned. The author has not received compensation for writing this article, other than from FXStreet.
FXStreet and the author do not provide personalized recommendations. The author makes no representations as to the accuracy, completeness, or suitability of this information. FXStreet and the author will not be liable for any errors, omissions or any losses, injuries or damages arising from this information and its display or use. Errors and omissions excepted.
The author and FXStreet are not registered investment advisors and nothing in this article is intended to be investment advice.
Recommended Content
Editors’ Picks
EUR/USD consolidates recovery below 1.0700 amid upbeat mood

EUR/USD is consolidating its recovery but remains below 1.0700 in early Europe on Thursday. The US Dollar holds its corrective decline amid a stabilizing market mood, despite looming Middle East geopolitical risks. Speeches from ECB and Fed officials remain on tap.
GBP/USD advances toward 1.2500 on weaker US Dollar

GBP/USD is extending recovery gains toward 1.2500 in the European morning on Thursday. The pair stays supported by a sustained US Dollar weakness alongside the US Treasury bond yields. Risk appetite also underpins the higher-yielding currency pair. ahead of mid-tier US data and Fedspeak.
Gold appears a ‘buy-the-dips’ trade on simmering Israel-Iran tensions

Gold price attempts another run to reclaim $2,400 amid looming geopolitical risks. US Dollar pulls back with Treasury yields despite hawkish Fedspeak, as risk appetite returns.
Manta Network price braces for volatility as $44 million worth of MANTA is due to flood markets

Manta Network price is defending support at $1.80 as multiple technical indicators flash bearish. 21.67 million MANTA tokens worth $44 million are due to flood markets in a cliff unlock on Thursday.
Have we seen the extent of the Fed rate repricing?

Markets have been mostly consolidating recent moves into Thursday. We’ve seen some profit taking on Dollar longs and renewed demand for US equities into the dip. Whether or not this holds up is a completely different story.
