EUR/USD Current price: 1.0934
View Live Chart for the EUR/USD
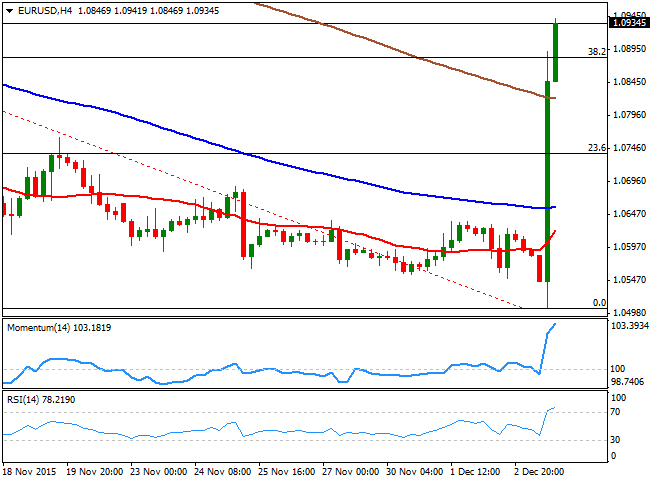
The ECB surprised investors this Thursday, by deciding to extend its asset purchase program until the end of March 2017 or beyond, but without expanding the amount of monthly purchases. Despite the Central Bank has also cut deposit rate by further 0.10%, leaving them at -0.30%, EUR bulls took over the FX board, as the announcements were quite short from markets' expectations. Stocks plummeted after the news and the EUR/USD pair skyrocketed after being as low as 1.0505 right after the release of the rates decision, adding over 400 pips intraday and finally meeting some selling interest around 1.0941. The American dollar was sold-off across the board, with the decline accelerating after the release of poor US services PMI figures for November, down to 55.9 from October reading of 59.1.
With the US Nonfarm Payroll release early Friday, is yet to be confirmed if EUR rally can be sustained in time, or if it's just the due correction after the pair lost over 1000 pips in the last two months. Technically, the 4 hours chart shows that the price has surpassed the 38.2% retracement of such decline, now the immediate support at 1.0880. In the same chart, the technical indicators are losing upward strength in extreme overbought territory, yet considering the wide daily range, technical readings will need a couple of days to adjust before becoming useful again. Overall, the upcoming direction will depend on how the market understands the US employment report in relation to a possible December rate hike. The key support will be then 1.0835 with a break below it required to confirm a bearish movement in the last day of the week.
Support levels: 1.0880 1.0835 1.0790
Resistance levels: 1.0945 1.0990 1.1040
EUR/JPY Current price: 134.04
View Live Chart for the EUR/JPY
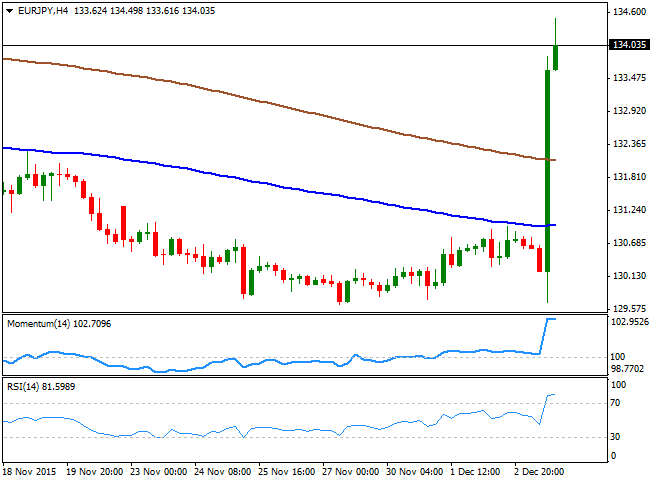
The EUR/JPY pair surged up to 134.49 and holds above the 134.00 level by the end of the day, boosted by EUR demand following a poor offer from ECB's Draghi after all of the jawboning of these past two months. The European Central Bank has largely anticipated and extension of its facilities, and investors priced in a monthly increase of QE of €10-20bn, something that Draghi failed to deliver. The pair advanced in a day, what it lost in the previous 5-weeks, and maintains a strong upward tone, despite technical indicators are a bit distorted following the larger intraday rally. The price has stalled around its 100 DMA while the technical indicators in the same chart maintain a strong bullish tone, suggesting that a break above 134.50 will favor further advances. In the 4 hours chart, the technical indicators have finally lost upward strength in extreme overbought levels, but are not yet suggesting a deeper corrective move. Below 134.00, the pair can decline down to 133.60, and it will take a break below this last level, to confirm further yen advances this Friday.
Support levels: 134.50 134.95 135.40
Resistance levels: 134.00 133.60 133.20
GBP/USD Current price: 1.5122
View Live Chart for the GBP/USD
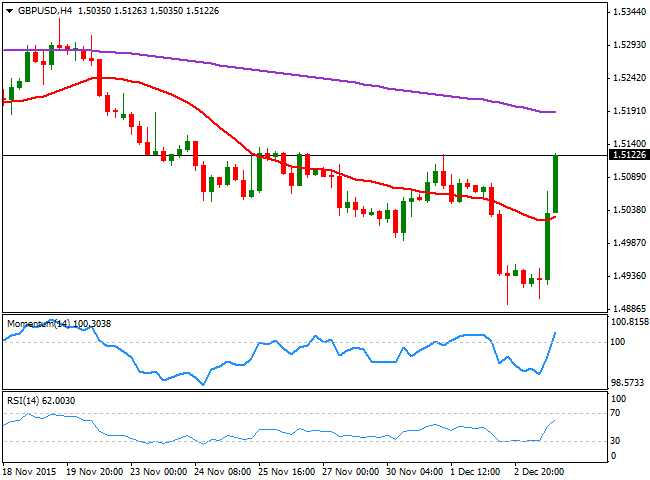
The British Pound got an early boost against its majors rivals during the European morning, following the release of better-than-expected UK services PMI data for November that surged to 55.9 from a previous reading of 54.9. The GBP/USD pair however, remained contained by selling interest around the 1.4960 level, before finally breaking through it on dollar's sell-off. The pair recovered up to 1.5126 in the American afternoon, and holds nearby at the end of the day. Having advanced around 200 pips, some consolidation should be expected now ahead of the release of US employment data on Friday. Technically, the 4 hours chart shows that the technical indicators maintain their bullish slopes after crossing above their mid-lines, whilst the price recovered well above its 20 SMA. The 200 EMA in the same chart, stands around 1.5190, being now the level to beat to confirm a more sustainable recovery in the mid-term.
Support levels: 1.5086 1.5050 1.5020
Resistance levels: 1.5125 1.5160 1.5190
USD/JPY Current price: 122.59
View Live Chart for the USD/JPY
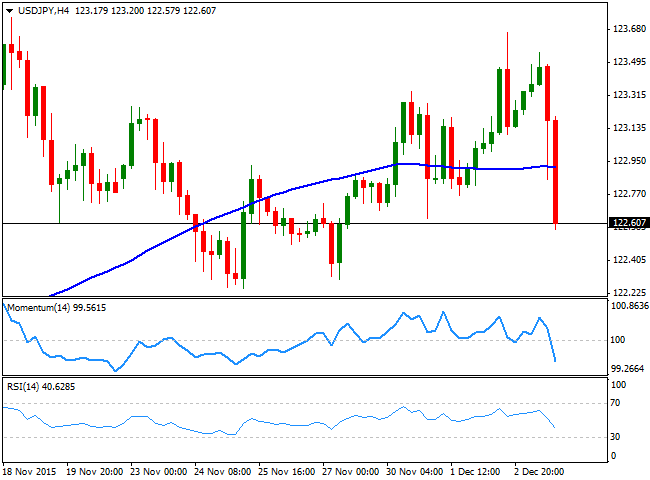
The USD/JPY pair fell down to the 122.50 region in the US afternoon, posting a modest decline compared to other majors as the pair remains within its latest weeks' range. Poor services data in the US, alongside with a strong decline in worldwide stocks, helped the Japanese yen to gain some ground, but the pair is far from setting a clear directional strength. Intraday, the technical picture has turned bearish, as the technical indicators have crossed their mid-lines towards the downside and maintain their strong bearish slopes, whilst the price has extended below its 100 SMA. Nevertheless, the pair needs to break below 122.20, a strong static support level, to confirm additional declines, with the market pointing then for a probable test of the 121.35 level, another strong static support. If the US employment report, however, comes out better-than-expected, chances are towards the upside, with a recovery above 123.10 required to confirm an advance towards the recent highs in the 123.60 region.
Support levels: 122.20 121.70 121.35
Resistance levels: 123.10 123.60 124.00
AUD/USD Current price: 0.7340
View Live Chart for the AUD/USD
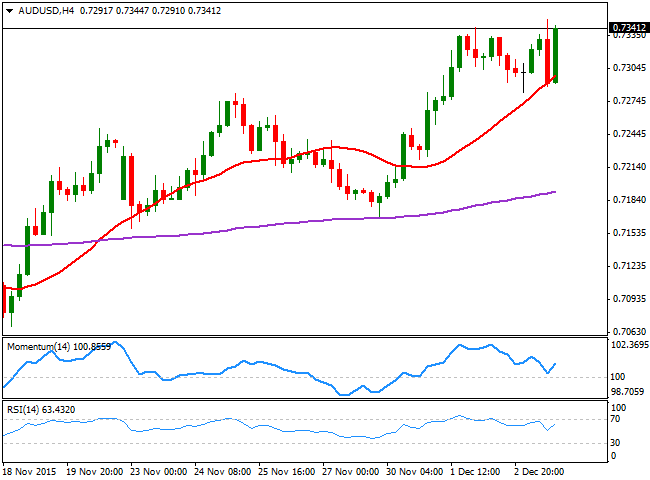
The AUD/USD pair recovered the ground lost last Wednesday and even established a fresh weekly high of 0.7349 this Thursday, having found some support in rising gold prices. There will be no relevant macroeconomic releases during the upcoming Asian session in Australia, which means that the pair will likely spend the session consolidating around the current level. From a technical perspective, the pair continued to find buying interest on dips, in line with the dominant bullish trend and is poised to extend its advance, given that the 4 hours chart shows that the technical indicators have bounced from their mid-lines, and maintain strong bullish slopes, while the price held above a bullish 20 SMA. The pair has now a strong static resistance around 0.7380, and a weekly close above it should signal a continued advance beyond the 0.75 figure for the next week.
Support levels: 0.7280 0.7240 0.7200
Resistance levels: 0.7380 0.7410 0.7450
Information on these pages contains forward-looking statements that involve risks and uncertainties. Markets and instruments profiled on this page are for informational purposes only and should not in any way come across as a recommendation to buy or sell in these assets. You should do your own thorough research before making any investment decisions. FXStreet does not in any way guarantee that this information is free from mistakes, errors, or material misstatements. It also does not guarantee that this information is of a timely nature. Investing in Open Markets involves a great deal of risk, including the loss of all or a portion of your investment, as well as emotional distress. All risks, losses and costs associated with investing, including total loss of principal, are your responsibility. The views and opinions expressed in this article are those of the authors and do not necessarily reflect the official policy or position of FXStreet nor its advertisers. The author will not be held responsible for information that is found at the end of links posted on this page.
If not otherwise explicitly mentioned in the body of the article, at the time of writing, the author has no position in any stock mentioned in this article and no business relationship with any company mentioned. The author has not received compensation for writing this article, other than from FXStreet.
FXStreet and the author do not provide personalized recommendations. The author makes no representations as to the accuracy, completeness, or suitability of this information. FXStreet and the author will not be liable for any errors, omissions or any losses, injuries or damages arising from this information and its display or use. Errors and omissions excepted.
The author and FXStreet are not registered investment advisors and nothing in this article is intended to be investment advice.
Recommended Content
Editors’ Picks
EUR/USD fluctuates in daily range above 1.0600

EUR/USD struggles to gather directional momentum and continues to fluctuate above 1.0600 on Tuesday. The modest improvement seen in risk mood limits the US Dollar's gains as investors await Fed Chairman Jerome Powell's speech.
GBP/USD stabilizes near 1.2450 ahead of Powell speech

GBP/USD holds steady at around 1.2450 after recovering from the multi-month low it touched near 1.2400 in the European morning. The USD struggles to gather strength after disappointing housing data. Market focus shifts to Fed Chairman Powell's appearance.
Gold retreats to $2,370 as US yields push higher

Gold stages a correction on Tuesday and fluctuates in negative territory near $2,370 following Monday's upsurge. The benchmark 10-year US Treasury bond yield continues to push higher above 4.6% and makes it difficult for XAU/USD to gain traction.
XRP struggles below $0.50 resistance as SEC vs. Ripple lawsuit likely to enter final pretrial conference

XRP is struggling with resistance at $0.50 as Ripple and the US Securities and Exchange Commission (SEC) are gearing up for the final pretrial conference on Tuesday at a New York court.
US outperformance continues

The economic divergence between the US and the rest of the world has become increasingly pronounced. The latest US inflation prints highlight that underlying inflation pressures seemingly remain stickier than in most other parts of the world.
