EUR/USD Current price: 1.0647
View Live Chart for the EUR/USD
The EUR/USD pair close the week near the 7-month low set at 1.0616, last Wednesday, maintaining the bearish trend established last October. After the upward corrective movement from past Thursday, the pair resumed its decline by the end of the week, helped by ECB's President Mario Draghi, who repeated the December´s QE extension rhetoric, in a speech before the European Banking Congress, in Frankfurt. At the same time, FED officers continued to hint a possible rate hike in December, keeping the greenback strong, particularly against its European rivals.The pair has shown little intraday volatility during the last two weeks, but that has resulted in a correction of the extreme oversold conditions reached lately, rather than signal downward exhaustion. Technically, the daily chart shows that that the price remains well below a sharply bearish 20 SMA, whilst the Momentum indicator has turned flat well below its 100 level after correcting oversold readings, whilst the RSI indicator is resuming its decline around 32. In the 4 hours chart, the pair presents a neutral-to-bearish stance, given that the price has been hovering back and forth around a horizontal 20 SMA, while the technical indicators present tepid bearish slopes around their mid-lines.
Support levels: 1.0630 1.0585 1.0550
Resistance levels: 1.0710 1.0750 1.0790
EUR/JPY Current price: 130.72
View Live Chart for the EUR/JPY
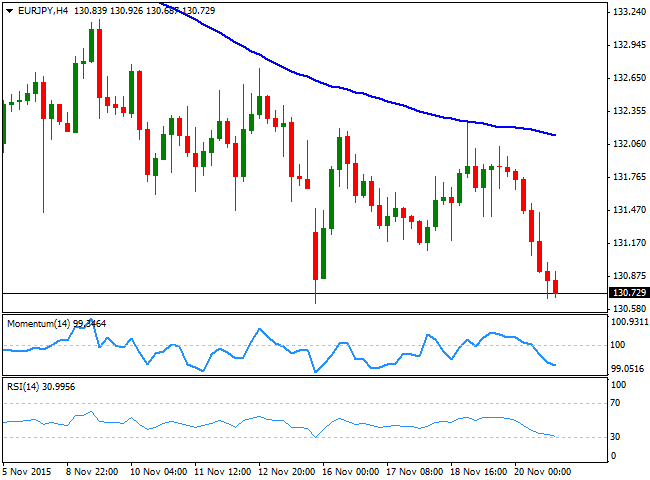
The EUR/JPY pair closed the week below the 131.00 level, and handful of pips above the multi-month low posted at 130.63 earlier last week. While the EUR is being weakened by continued jawboning by ECB officers on further easing the BOJ has decided to maintain the status quo, despite continued speculation of further easing in Japan, as inflation remains well below the central bank´s target. Anyway, the Japanese yen strengthened in a combination of a steady BOJ and soft US data, leaving the EUR/JPY in the path of a bearish continuation, as the daily chart shows that the price has fallen further below its moving averages, whilst the technical indicators have resumed their downward movements below their mid-lines. In the 4 hours chart, the technical indicators head sharply lower below their mid-lines, whilst an early advance during the week met selling interest around the 100 SMA, currently at 132.20.
Support levels: 130.90 130.55 130.20
Resistance levels: 131.70 132.10 132.60
GBP/USD Current price: 1.5191
View Live Chart for the GPB/USD
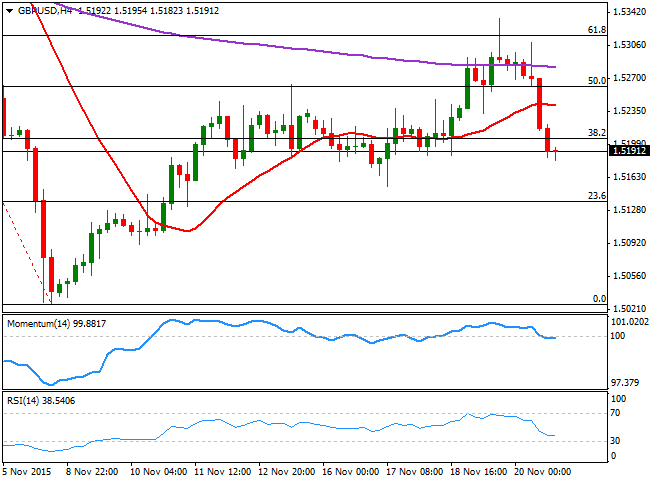
The GBP/USD pair advanced steadily over these last few days, reaching a fresh 2-week high of 1.5334, but plummeted on Friday to close the week in the red, with no clear catalyst behind the decline beyond dollar's strength. The Pound received some attention after BOE's member Broadbent said that the Central Bank´s inflation forecast is not as relevant as the economic behavior when it comes to determinate when to rise rates, mid last week, but investors enthusiasm faded on poor retail sales data. The technical picture suggests a major correction has been completed, as the price retraced from the 61.8% retracement of the November decline. In the daily chart, the price is well below a bearish 20 SMA, whilst the technical indicators head south below their mid-lines, maintaining the risk towards the downside. In the 4 hours chart, the Momentum indicator is flat right below its 100 level, while the RSI indicator holds around 38, whilst the price stands well below its moving averages, also indicating additional declines particularly on a break below 1.5160.
Support levels: 1.5160 1.5130 1.5085
Resistance levels: 1.5220 1.5265 1.5320
USD/JPY Current price: 122.82
View Live Chart for the USD/JPY
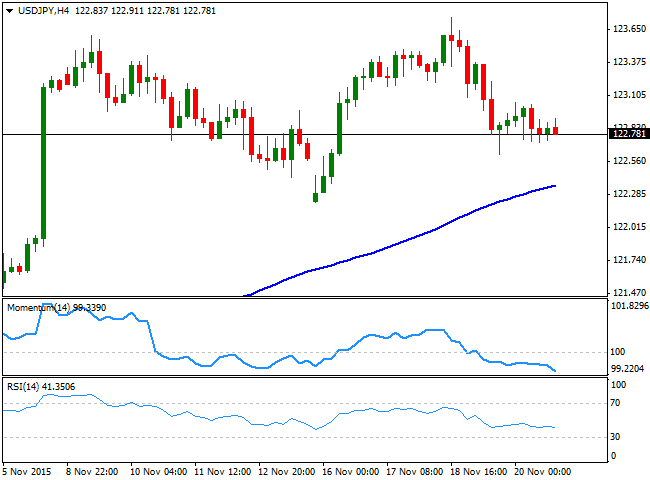
The USD/JPY pair erased most of its weekly gains and closed last Friday at 122.78, with the Japanese yen advancing after the Bank of Japan decided to maintain its current pace of monetary stimulus unchanged in its monthly meeting. Also, Sayuri Shirai, a member of the BOJ policy Board, said last Friday that financial stability is not a major concern now, but that the bank is watching it closely, whilst reiterating that the quantitative easing will remain as long as necessary to meet the 2.0% inflation goal. The daily chart for the USD/JPY pair shows that the price remains above its 100 and 200 SMAs, both together around 121.40 whilst the technical indicators continue retreating from overbought levels, heading towards their mid-lines. Shorter term, the 4 hours chart shows that the Momentum indicator has accelerated strongly below the 100 level, while the RSI indicator heads south around 41 supporting a continued decline on a break below 122.60, November 19th low and the immediate support.
Support levels: 122.60 122.20 121.70
Resistance levels: 123.05 123.40 123.75
AUD/USD Current price: 0.7237
View Live Chart for the AUD/USD
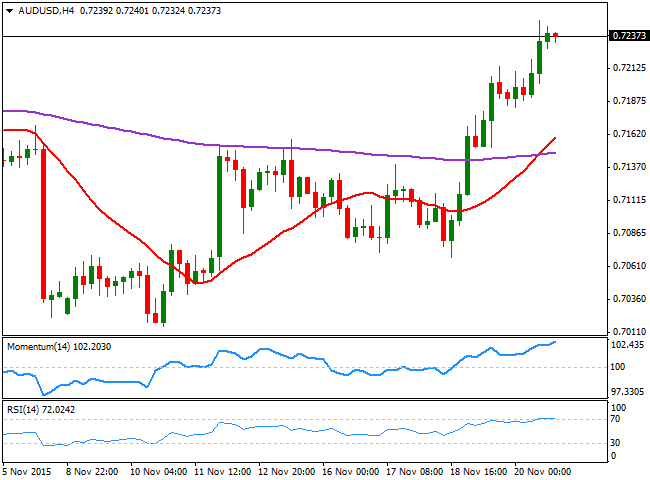
The Australian dollar surged to a 3-week high of 0.7249 against its American rival, and closed the week a few pips below such high, standing among the best weekly performers. The Aussie got a boost last Friday, after the PBOC announced a rate cut for its Standing Lending Facility (SLF) for local financial institutions across several maturities, in another attempt to support local economic growth. The AUD/USD daily chart shows that the price has advanced well above a bullish 20 SMA, whilst closing above its 100 DMA, for the first time in almost three months, and that that the technical indicators maintain their bullish slopes well above their mid-lines, all of which supports further advances. In the 4 hours chart, the Momentum indicator maintains its upward slope, despite being in extreme overbought territory, whilst the RSI has lost its upward strength, but holds around 72, supporting some consolidation ahead the next directional move.
Support levels: 0.7195 0.7150 0.7110
Resistance levels: 0.7250 0.7285 0.7330
Information on these pages contains forward-looking statements that involve risks and uncertainties. Markets and instruments profiled on this page are for informational purposes only and should not in any way come across as a recommendation to buy or sell in these assets. You should do your own thorough research before making any investment decisions. FXStreet does not in any way guarantee that this information is free from mistakes, errors, or material misstatements. It also does not guarantee that this information is of a timely nature. Investing in Open Markets involves a great deal of risk, including the loss of all or a portion of your investment, as well as emotional distress. All risks, losses and costs associated with investing, including total loss of principal, are your responsibility. The views and opinions expressed in this article are those of the authors and do not necessarily reflect the official policy or position of FXStreet nor its advertisers. The author will not be held responsible for information that is found at the end of links posted on this page.
If not otherwise explicitly mentioned in the body of the article, at the time of writing, the author has no position in any stock mentioned in this article and no business relationship with any company mentioned. The author has not received compensation for writing this article, other than from FXStreet.
FXStreet and the author do not provide personalized recommendations. The author makes no representations as to the accuracy, completeness, or suitability of this information. FXStreet and the author will not be liable for any errors, omissions or any losses, injuries or damages arising from this information and its display or use. Errors and omissions excepted.
The author and FXStreet are not registered investment advisors and nothing in this article is intended to be investment advice.
Recommended Content
Editors’ Picks
EUR/USD holds above 1.0600 as focus shifts to Powell speech

EUR/USD fluctuates in a narrow range above 1.0600 on Tuesday as the better-than-expected Economic Sentiment data from Germany helps the Euro hold its ground. Fed Chairman Powell will speak on the policy outlook later in the day.
GBP/USD stays below 1.2450 after UK employment data

GBP/USD trades marginally lower on the day below 1.2450 in the early European session on Tuesday. The data from the UK showed that the ILO Unemployment Rate in February rose to 4.2% from 4%, weighing on Pound Sterling.
Will Gold reclaim $2,400 ahead of Powell speech?

Gold price consolidates the rebound below $2,400 amid risk-aversion. Dollar gains on strong US Retail Sales data despite easing Middle East tensions. Bullish potential for Gold price still intact on favorable four-hour technical setup.
SOL primed for a breakout as it completes a rounding bottom pattern

Solana price has conformed to the broader market crash, following in the steps of Bitcoin price that remains in the red below the $65,000 threshold. For SOL, however, the sensational altcoin could have a big move in store.
Canada CPI Preview: Inflation expected to accelerate in March, snapping two-month downtrend

The Canadian Consumer Price Index is seen gathering some upside traction in March. The BoC deems risks to the inflation outlook to be balanced. The Canadian Dollar navigates five-month lows against the US Dollar.
