EUR/USD Current price: 1.0721
View Live Chart for the EUR/USD
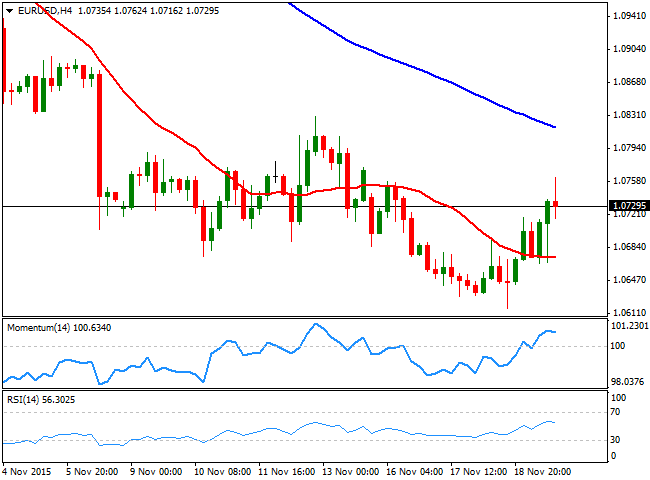
The American dollar ended the day lower against all of its major rivals, as the positive mood among worldwide investors grew following the release of the latest US FOMC Minutes. Dollar bulls unwind positions for riskier assets, and lackluster US macroeconomic data helped the greenback to fall. Weekly unemployment claims, in the week ended Nov 13, met expectations printing 271K, whilst the Conference Board Leading Economic Index increased 0.6% in October to 124.1, following a 0.1% decline in September, and a 0.1% decline in August.The EUR/USD pair surged up to 1.0762, before retracing some, but holds to most of its recent gains around its last week comfort zone, around 1.0740/50. The 1 hour chart shows that the pair is founding some buying interest around its 200 SMA, whilst the 20 SMA heads higher below the current level. In the same chart, the technical indicators have retreated towards their mid-lines alongside with price, but are far from suggesting a bearish continuation. In the 4 hours chart, the price has advanced above its 20 SMA, whilst the technical indicators are losing their upward strength above their mid-lines, supporting some consolidation ahead before the next move. Sellers have surged on approaches to the 1.0800 level, which means a steady gains beyond it is required to confirm additional gains for this Friday.
Support levels: 1.0680 1.0630 1.0585
Resistance levels: 1.0720 1.0750 1.0790
GBP/USD Current price: 1.5293
View Live Chart for the GPB/USD
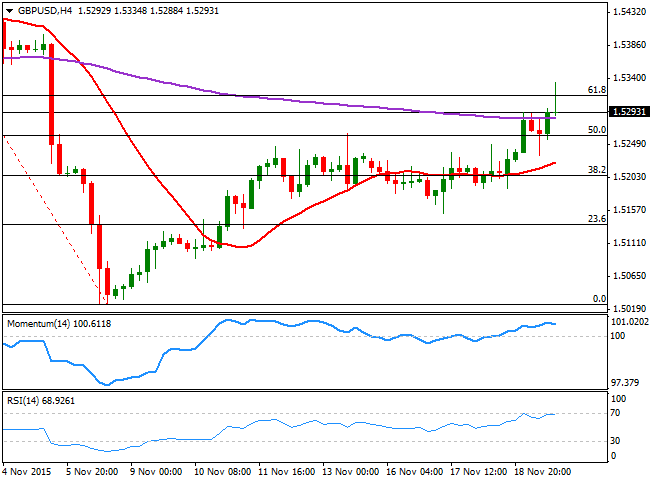
The GBP/USD pair rallied up to a fresh 2-week high of 1.5335 in the American afternoon, despite soft UK macroeconomic data released during the European morning. According to official data, the UK retail sales fell by 0.6% in October, compared to September this year, and rose by 3.8% against market expectations of 4.2% advance. The pair retreated back below the 1.5300 figure, but maintains a positive tone short term that supports further gains for this last day of the week, as the 1 hour chart shows that the technical indicators are resuming their advances after approaching their mid-lines, whist the price is still well above a bullish 20 SMA. In the 4 hours chart, the price has advanced above its 200 EMA, currently at 1.5280, for their first time since November 5th, whilst the 20 SMA is slowly gaining upward slope well below the current level. In this last time frame, the technical indicators are losing their upward strength near overbought levels, but are far from suggesting a downward move ahead. The price has briefly advanced above the 61.8% retracement of its latest decline at 1.5320, the immediate resistance, with a break above it required to confirm further gains towards fresh highs.
Support levels: 15280 1.5245 1.5200
Resistance levels: 1.5320 1.5355 11.5390
USD/JPY Current price: 123.78
View Live Chart for the USD/JPY
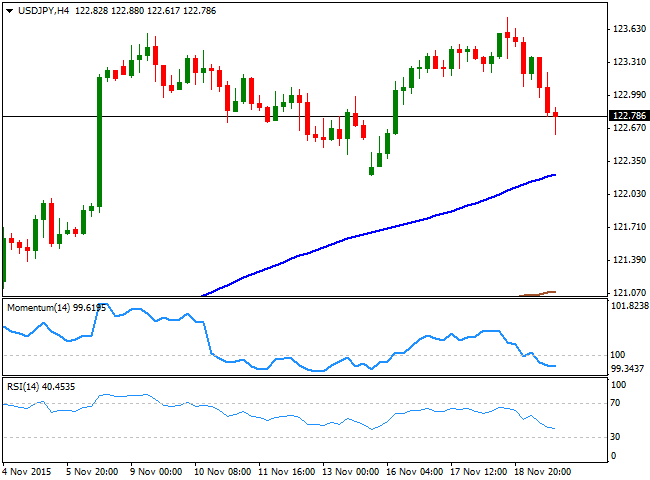
The Japanese yen strengthened this Thursday, as the Bank of Japan decided to keep its current pace of monetary stimulus unchanged in its monthly economic meeting. The Central Bank also kept intact its assessment that the economy will continue to recover at a moderate pace, whilst reiterating that they will keep on increasing their monetary base to reach the 2.0% inflation target. The broad dollar weakness later in the day did the rest, and the USD/JPY pair plunged to 122.61. Trading a few pips above the level, the short term picture is bearish, as in the 1 hour chart, the price has fallen down below the 100 and 200 SMAs whilst the technical indicators have resumed their declines after a limited upward corrective movement from oversold readings. In the 4 hours chart, the technical indicators are heading sharply lower below their mid-lines, supporting further declines particularly on a break below 122.20,this week low and the immediate support.
Support levels: 122.20 121.70 121.35
Resistance levels: 123.00 123.40 123.75
AUD/USD Current price: 0.7193
View Live Chart for the AUD/USD
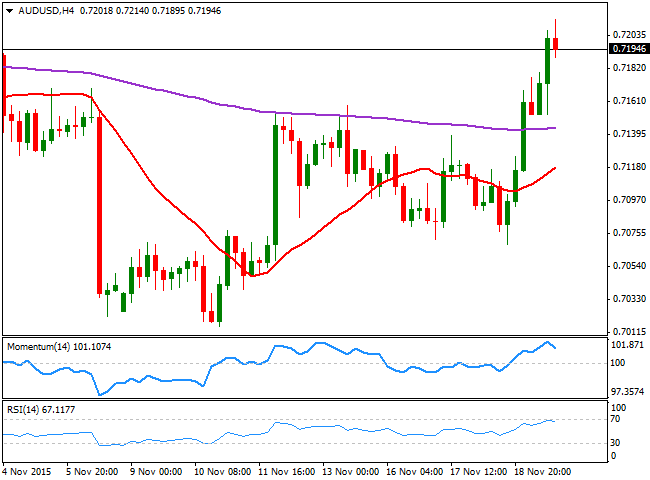
The Australian dollar was among the most benefited by improved risk sentiment, recovering up to 0.7214 against its American rival, and closing the day around the 0.7200 figure, the highest for this November. The 1 hour chart for the AUD/USD pair shows that the price holds near its highs and well above a bullish 20 SMA, whilst the technical indicators have retreated from extreme overbought readings, but are losing their bearish strength well above their mid-lines, suggesting the ongoing decline is barely corrective. In the 4 hours chart, the price is above its 20 and 200 EMAs, while the technical indicators are retreating some from overbought levels. The pair has a strong static resistance at 0.7240 and a break above it should lead to further gains for this Friday, whilst failure around the level should see the pair resuming its decline back towards the 0.7000 figure.
Support levels: 0.7150 0.7110 0.7070
Resistance levels: 0.7240 0.7285 0.7330
Information on these pages contains forward-looking statements that involve risks and uncertainties. Markets and instruments profiled on this page are for informational purposes only and should not in any way come across as a recommendation to buy or sell in these assets. You should do your own thorough research before making any investment decisions. FXStreet does not in any way guarantee that this information is free from mistakes, errors, or material misstatements. It also does not guarantee that this information is of a timely nature. Investing in Open Markets involves a great deal of risk, including the loss of all or a portion of your investment, as well as emotional distress. All risks, losses and costs associated with investing, including total loss of principal, are your responsibility. The views and opinions expressed in this article are those of the authors and do not necessarily reflect the official policy or position of FXStreet nor its advertisers. The author will not be held responsible for information that is found at the end of links posted on this page.
If not otherwise explicitly mentioned in the body of the article, at the time of writing, the author has no position in any stock mentioned in this article and no business relationship with any company mentioned. The author has not received compensation for writing this article, other than from FXStreet.
FXStreet and the author do not provide personalized recommendations. The author makes no representations as to the accuracy, completeness, or suitability of this information. FXStreet and the author will not be liable for any errors, omissions or any losses, injuries or damages arising from this information and its display or use. Errors and omissions excepted.
The author and FXStreet are not registered investment advisors and nothing in this article is intended to be investment advice.
Recommended Content
Editors’ Picks
EUR/USD clings to gains near 1.0700, awaits key US data

EUR/USD clings to gains near the 1.0700 level in early Europe on Thursday. Renewed US Dollar weakness offsets the risk-off market environment, supporting the pair ahead of the key US GDP and PCE inflation data.
USD/JPY keeps pushing higher, eyes 156.00 ahead of US GDP data

USD/JPY keeps breaking into its highest chart territory since June of 1990 early Thursday, recapturing 155.50 for the first time in 34 years as the Japanese Yen remains vulnerable, despite looming intervention risks. The focus shifts to Thursday's US GDP report and the BoJ decision on Friday.
Gold closes below key $2,318 support, US GDP holds the key

Gold price is breathing a sigh of relief early Thursday after testing offers near $2,315 once again. Broad risk-aversion seems to be helping Gold find a floor, as traders refrain from placing any fresh directional bets on the bright metal ahead of the preliminary reading of the US first-quarter GDP due later on Thursday.
Injective price weakness persists despite over 5.9 million INJ tokens burned

Injective price is trading with a bearish bias, stuck in the lower section of the market range. The bearish outlook abounds despite the network's deflationary efforts to pump the price.
Meta takes a guidance slide amidst the battle between yields and earnings

Meta's disappointing outlook cast doubt on whether the market's enthusiasm for artificial intelligence. Investors now brace for significant macroeconomic challenges ahead, particularly with the release of first-quarter GDP data.
