EUR/USD Current price: 1.1020
View Live Chart for the EUR/USD
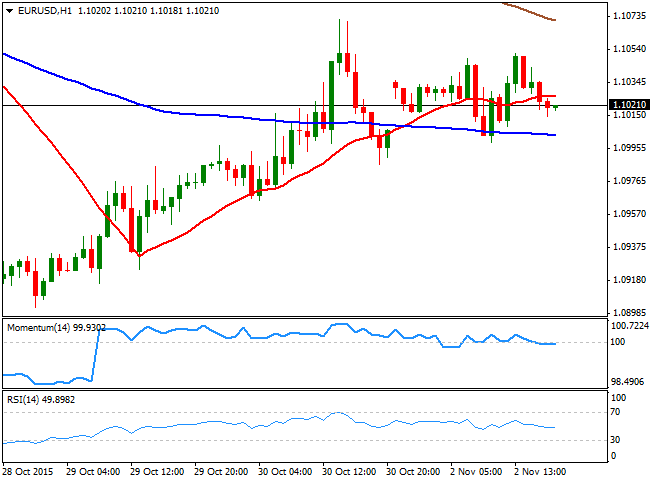
There was little action across the forex board this Monday, but generally speaking, the dollar refused to give up. The day started with soft Chinese data, which showed that the official manufacturing PMI remained below 50 in October, matching September reading of 49.8. The service sector grew less than previously, resulting at 53.1 against September figure of 53.4. The figures were far from encouraging, and Asian shares ended the day lower. In Europe however, the manufacturing sector grew more than expected, sending local share markets higher, yet not enough to boost the common currency that faltered around the 1.1050 level against the greenback. In the US, the manufacturing sector posted a modest rebound in October, according to Markit, up to 54.1 from the previous 53.1.The EUR/USD pair traded within 50 pips during this first day of the week, having been unable to set a clear directional tone. The overall bearish tone established by the Central Banks remains firm in place, with market's attention now centered in the upcoming release of US employment figures lately this week. Short term, the 1 hour chart shows that the price hovers around a horizontal 20 SMA, whilst the technical indicators maintain a neutral stance. In the 4 hours chart, the price has been consolidating above a mild bearish 20 SMA, while the Momentum indicator has lost its negative slope after correcting oversold conditions, but is far from supporting a rally, and the RSI indicator heads lower around 50. The pair has been contained by selling interest around 1.1080/90 ever since breaking lower, which means only above the level the outlook will be more constructive, at least, short term.
Support levels: 1.1000 1.0960 1.0920
Resistance levels: 1.1050 1.1085 1.1120
EUR/JPY Current price: 133.09
View Live Chart for the EUR/JPY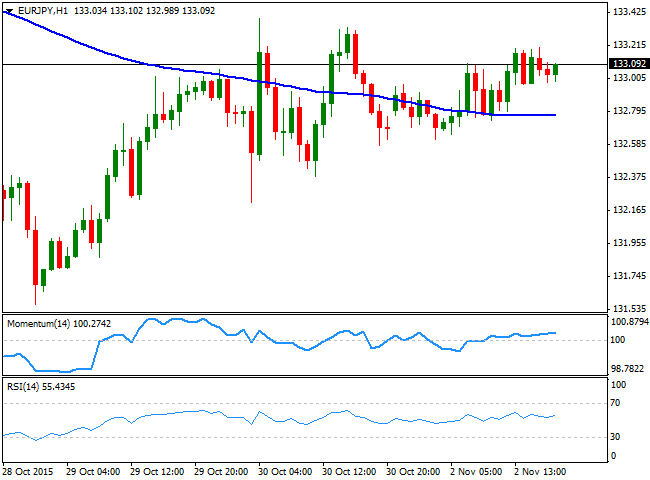
The EUR/JPY pair ended the day with limited gains above the 133.00 level, trading however, within Friday's range. The Japanese yen eased some during the second half of the day as European and American stocks edged higher, helping the pair in recovering some of its latest losses. Nevertheless, the longer term outlook is still bearish, as the daily chart shows that the technical indicators have barely corrected oversold readings whilst the price develops well below its moving averages. Shorter term, the 1 hour chart shows that the price has advanced some above its 100 SMA while the technical indicators hold above their mid-lines, but lacking upward strength. In the 4 hours chart, the price remains well below its moving averages, and the technical indicators have turned lower, heading towards their mid-lines, keeping the risk towards the downside.
Support levels: 132.50 132.10 131.60
Resistance levels: 133.45 133.90 134.40
GBP/USD Current price: 1.5420
View Live Chart for the GPB/USD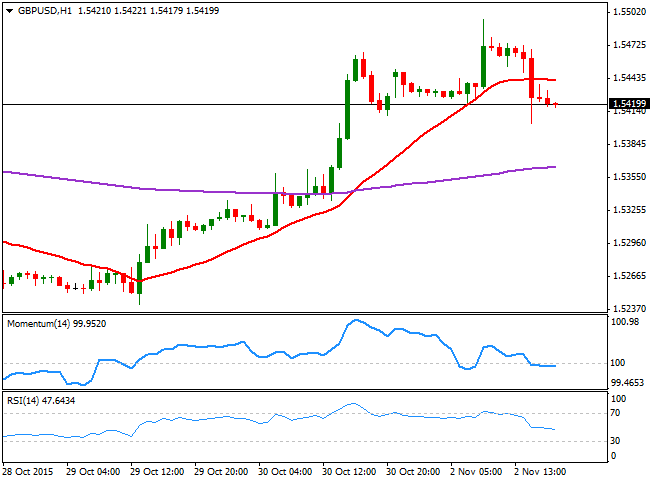
The GBP/USD pair enjoyed some short-lived demand during the European morning, after the release of better-than-expected data in the UK. Markit reported that growth regained momentum in October, as the manufacturing sector recorded its best month of output since June 2014, with the final October manufacturing PMI resulting at 55.5, compared to a first estimate of 51.5. The pair advanced up to 1.5496, but once again failed around the 1.5500 figure, and ended the day in the red, a few pips above the 1.5400 level. The BoE will have its monetary policy meeting this week, alongside with the release of the inflation report, and the market will be looking there for clues on any date for an upcoming rate hike. In the meantime, the short term picture favors additional declines, as in the 1 hour chart, the price is developing below its 20 SMA, whilst the technical indicators present tepid bearish slopes below their mid-lines. In the 4 hours chart, the technical indicators are retreating from overbought territory, but the 20 SMA maintains a sharp bullish slope below the current level, indicating limited slides ahead for the pair.
Support levels: 1.5405 1.5375 1.5330
Resistance levels: 1.5460 1.5500 1.5540
USD/JPY Current price: 120.68
View Live Chart for the USD/JPY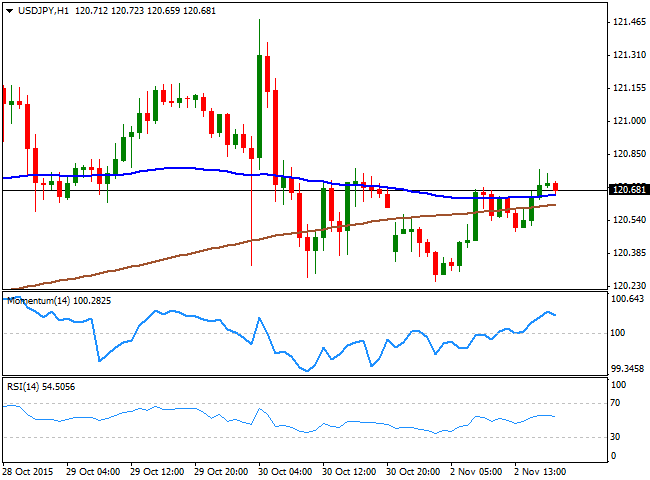
The USD/JPY pair declined at the beginning of the day, down to 120.25 as local share markets fell, but bounced some as markets' sentiment flipped towards positive mid European morning. Nevertheless, the pair traded uneventfully in a tight range, still waiting for a trigger that can actually set the tone. Short term, the technical picture is mildly positive, as the price has managed to advance above its moving averages that anyway remain flat, while the technical indicators are holding above their mid-lines, although losing upward strength. In the 4 hours chart, however, the Momentum indicator maintains its bearish slope below its 100 level, while the RSI indicator hovers around 50. The pair has been trading pretty much between 119.35 and 121.45 with short lived declines below the base for over two months, and market seems determinate to play that range at least until next Friday when the US will release its Nonfarm Payroll data for October.
Support levels: 120.35 120.00 119.70
Resistance levels: 121.00 121.45 121.80
AUD/USD Current price: 0.7134
View Live Chart for the AUD/USD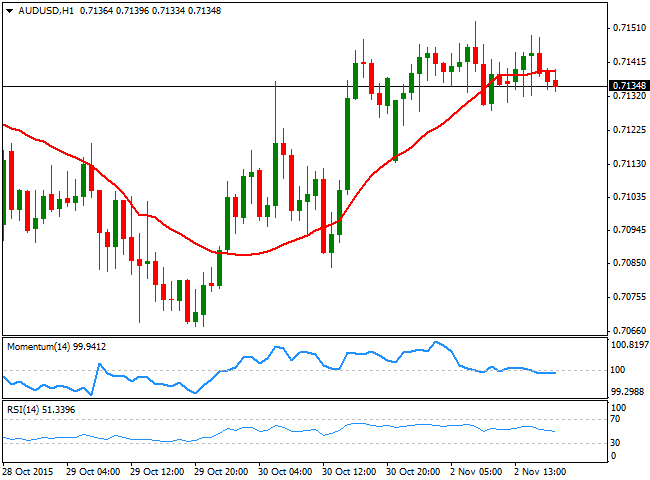
The AUD/USD pair ended the day unchanged this Monday around the 0.7130 level, as investors are waiting for the upcoming RBA economic policy at the beginning of this Tuesday. The market broadly expects the RBA to maintain its rates unchanged, although latest inflation figures in Australia have fueled speculation that the Central Bank may decide to cut one more time from the current 2.0%. Although no action is expected for this particular meeting, the statement can well define if officers are still comfortable with the ongoing situation, as they were last month. Technically, the short term picture is neutral, as in the 1 hour chart, the price stands a few pips below a flat 20 SMA, whilst the technical indicators hover around their mid-lines. In the 4 hours chart, the technical picture is neutral, with the technical indicators heading nowhere above their mid-lines and the 20 SMA flat around 0.7100.
Support levels: 0.7100 0.7065 0.7020
Resistance levels: 0.7160 0.7195 0.7240
Information on these pages contains forward-looking statements that involve risks and uncertainties. Markets and instruments profiled on this page are for informational purposes only and should not in any way come across as a recommendation to buy or sell in these assets. You should do your own thorough research before making any investment decisions. FXStreet does not in any way guarantee that this information is free from mistakes, errors, or material misstatements. It also does not guarantee that this information is of a timely nature. Investing in Open Markets involves a great deal of risk, including the loss of all or a portion of your investment, as well as emotional distress. All risks, losses and costs associated with investing, including total loss of principal, are your responsibility. The views and opinions expressed in this article are those of the authors and do not necessarily reflect the official policy or position of FXStreet nor its advertisers. The author will not be held responsible for information that is found at the end of links posted on this page.
If not otherwise explicitly mentioned in the body of the article, at the time of writing, the author has no position in any stock mentioned in this article and no business relationship with any company mentioned. The author has not received compensation for writing this article, other than from FXStreet.
FXStreet and the author do not provide personalized recommendations. The author makes no representations as to the accuracy, completeness, or suitability of this information. FXStreet and the author will not be liable for any errors, omissions or any losses, injuries or damages arising from this information and its display or use. Errors and omissions excepted.
The author and FXStreet are not registered investment advisors and nothing in this article is intended to be investment advice.
Recommended Content
Editors’ Picks
EUR/USD retreats below 1.0700 after US GDP data

EUR/USD came under modest bearish pressure and retreated below 1.0700. Although the US data showed that the economy grew at a softer pace than expected in Q1, strong inflation-related details provided a boost to the USD.
GBP/USD declines below 1.2500 as USD rebounds

GBP/USD declined below 1.2500 and erased the majority of its daily gains with the immediate reaction to the US GDP report. The US economy expanded at a softer pace than expected in Q1 but the price deflator jumped to 3.4% from 1.8%.
Gold drops below $2,320 as US yields shoot higher

Gold lost its traction and turned negative on the day below $2,320 in the American session on Thursday. The benchmark 10-year US Treasury bond yield is up more than 1% on the day above 4.7% after US GDP report, weighing on XAU/USD.
XRP extends its decline, crypto experts comment on Ripple stablecoin and benefits for XRP Ledger

Ripple extends decline to $0.52 on Thursday, wipes out weekly gains. Crypto expert asks Ripple CTO how the stablecoin will benefit the XRP Ledger and native token XRP.
After the US close, it’s the Tokyo CPI

After the US close, it’s the Tokyo CPI, a reliable indicator of the national number and then the BoJ policy announcement. Tokyo CPI ex food and energy in Japan was a rise to 2.90% in March from 2.50%.
