EUR/USD Current price: 1.1051
View Live Chart for the EUR/USD
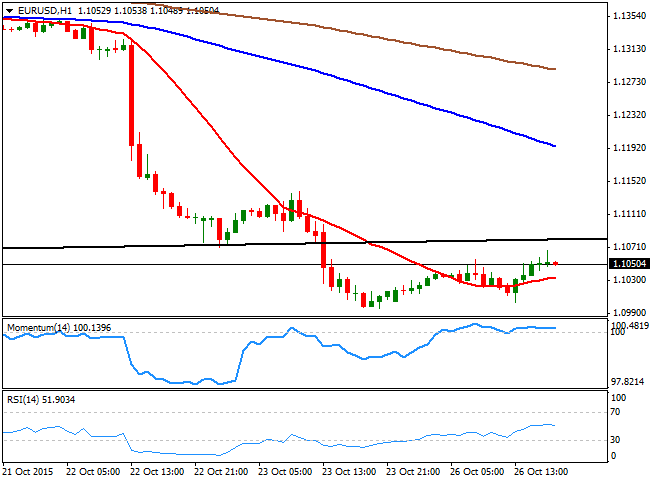
The American dollar ended the day with limited losses across the board, with the EUR/USD pair up to 1.1067 during the US session. Markets were still digesting the latest economic policy decisions from the ECB and the PBoC, whilst waiting for the FED and the BOJ later on this week. As for the macroeconomic picture, German business confidence fell for the first time in four months in October, according to the latest IFO survey, as the index declined to 108.2 from 108.5 in September. In the US, New Home sales was a huge disappointment, as during September, fell 11.5% to an annual rate of 468,000, the lowest level in 10 months. Also, the Dallas Fed Manufacturing Index came in at -12.7 for October, well below the estimated -6.5% in October.
The poor figures in the US had done little against Draghi's words, as the EUR/USD pair has been pretty much consolidating its latest losses, with no aims of changing its newly acquired bearish trend. The short term picture continues to favor the downside, given that the price is barely hovering above a flat 20 SMA, whilst the technical indicators have lost their upward strength after gaining positive territory, and now turn south. In the 4 hours chart, the 20 SMA has extended its slide and presents a sharp bearish slope well above the current level, whilst the Momentum indicator heads higher, but below the 100 level, and the RSI indicator consolidates around 30 after correcting extreme oversold readings.
Support levels: 1.1000 1.0960 1.0920
Resistance levels: 1.1080 1.1120 1.1160
EUR/JPY Current price: 133.74
View Live Chart for the EUR/JPY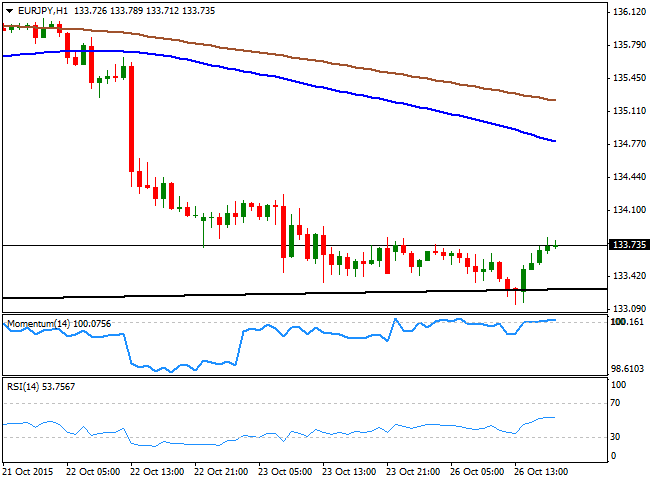
The EUR/JPY fell down to 133.15 during the past Asian session, as the Japanese Yen strengthened at the beginning of the day while local investors digest the latest measures announced by the PBoC. The pair bounced, however, after flirting with the base of the long term symmetrical triangle that has been containing price action ever since late April, although the bearish pressure remains, given that the pair is well below its 100 and 200 DMAs. Shorter term, the 1 hour chart shows that the price is well below its 100 and 200 SMAs that have turned lower after an extended period of consolidation, whilst the technical indicators have turned flat around their mid-lines after correcting oversold readings. In the 4 hours chart, the technical indicators continue heading north, but in negative territory, rather reflecting the latest upward corrective move than supporting further advances.
Support levels: 133.20 132.65 132.25
Resistance levels: 133.80 134.40 134.95
GBP/USD Current price: 1.5338
View Live Chart for the GPB/USD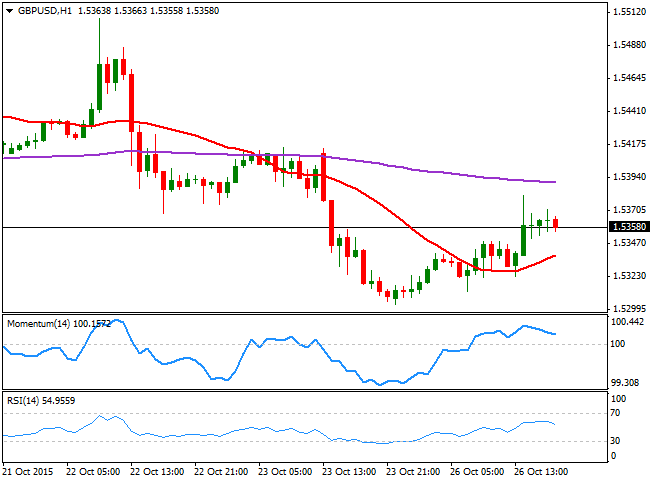
The GBP/USD pair has posted a limited intraday advance, retreating at the end of the day, from a daily high established at 1.5381. Data coming from the UK was for the most, disappointing, as manufacturing production edged downwards during the three months to October, marking the first decline in the last two years, according to the CBI Quarterly Industrial Trends Survey, whilst Mortgage Approvals fell to 44,489 in September from 46,567 in August, but were 14% up from the same time a year ago, according to the British Bankers' Association. From a technical point of view, the 1 hour chart presents a limited upward tone, as despite the pair is above a bullish 20 SMA, the technical indicators have lost their bullish strength, and are turning south above their mid-lines. In the 4 hours chart, however, the risk remains towards the downside, as the price has faltered around a bearish 20 SMA, while the technical indicators remain in negative territory, and the RSI indicator is already turning south around 44.
Support levels: 1.5320 1.5285 1.5250
Resistance levels: 1.5380 1.5415 1.5450
USD/JPY Current price: 121.07
View Live Chart for the USD/JPY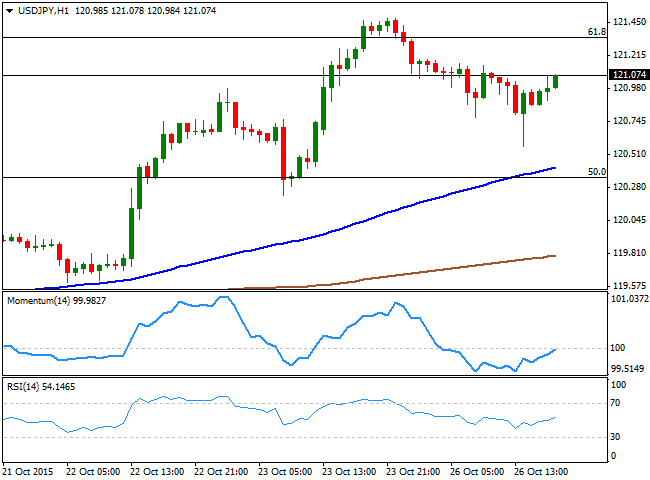
The USD/JPY pair erased most of its intraday losses, recovering from a daily low of 120.57 reached after the release of US disappointing data, recovering above the 121.00 level by the end of the day. The Japanese Yen got a boost during the previous Asian session, after PM Abe adviser, Hamada, stated that there's no need for the BOJ to ease, as long as market expectations for a FED rate hike keep the yen weak. Nevertheless, investors are now convinced that the latest ECB decision may force the BOJ to act, to prevent further JPY appreciation. The pair is still unable to overcome its 200 DMA, a major resistance level tested by the end of the last week around 121.45, but the 1 hour chart shows that the bullish potential is increasing, as the technical indicators are crossing their mid-lines towards the upside, whilst the price is clearly above a bullish 20 SMA. In the 4 hours chart, the Momentum indicator retreated from overbought levels and continues heading lower above its 100 level, although the RSI has turned back higher after correcting extreme readings, now heading higher around 62, all of which supports further gains for this Tuesday.
Support levels: 120.70 120.35 120.00
Resistance levels: 121.45 121.80 122.05
AUD/USD Current price: 0.7251
View Live Chart for the AUD/USD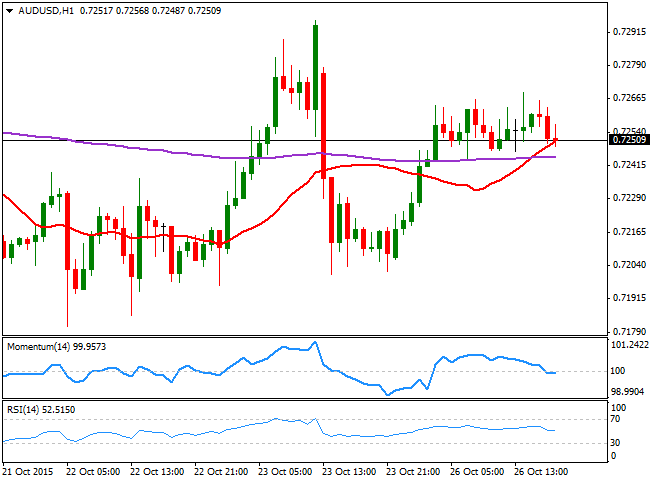
The AUD/USD pair advanced up to 0.7269 in the American afternoon, having been advancing ever since the day started. But the rally lost steam, as commodities remained under pressure, despite dollar's intraday weakness, with gold prices unable to hold to their early gains. The technical picture shows that the pair has been limited to a tight range for most of this Monday, with the price meeting short term buying interest around 0.7240, now the immediate support. In the 1 hour chart, the price is struggling around a bullish 20 SMA, whilst the technical indicators have turned lower, now hovering around their mid-lines, and still unable to confirm further declines. In the 4 hours chart, the price remains above its 20 SMA, but the technical indicators are turning slightly lower above their mid-lines, lacking directional strength at the time being. In this last time frame, the 200 EMA stands around 0.7190, a major support as the price has held above it for most of this October, with buyers still defending the level.
Support levels: 0.7240 0.7190 0.7150
Resistance levels: 0.7290 0.7335 0.7330
Information on these pages contains forward-looking statements that involve risks and uncertainties. Markets and instruments profiled on this page are for informational purposes only and should not in any way come across as a recommendation to buy or sell in these assets. You should do your own thorough research before making any investment decisions. FXStreet does not in any way guarantee that this information is free from mistakes, errors, or material misstatements. It also does not guarantee that this information is of a timely nature. Investing in Open Markets involves a great deal of risk, including the loss of all or a portion of your investment, as well as emotional distress. All risks, losses and costs associated with investing, including total loss of principal, are your responsibility. The views and opinions expressed in this article are those of the authors and do not necessarily reflect the official policy or position of FXStreet nor its advertisers. The author will not be held responsible for information that is found at the end of links posted on this page.
If not otherwise explicitly mentioned in the body of the article, at the time of writing, the author has no position in any stock mentioned in this article and no business relationship with any company mentioned. The author has not received compensation for writing this article, other than from FXStreet.
FXStreet and the author do not provide personalized recommendations. The author makes no representations as to the accuracy, completeness, or suitability of this information. FXStreet and the author will not be liable for any errors, omissions or any losses, injuries or damages arising from this information and its display or use. Errors and omissions excepted.
The author and FXStreet are not registered investment advisors and nothing in this article is intended to be investment advice.
Recommended Content
Editors’ Picks
AUD/USD rises to two-day high ahead of Australian CPI

The Aussie Dollar recorded back-to-back positive days against the US Dollar and climbed more than 0.59% on Tuesday, as the US April S&P PMIs were weaker than expected. That spurred speculations that the Federal Reserve could put rate cuts back on the table. The AUD/USD trades at 0.6488 as Wednesday’s Asian session begins.
EUR/USD holds above 1.0700 on weaker US Dollar, upbeat Eurozone PMI

EUR/USD holds above the 1.0700 psychological barrier during the early Asian session on Wednesday. The weaker-than-expected US PMI data for April drags the Greenback lower and creates a tailwind for the pair.
Gold price cautious despite weaker US Dollar and falling US yields

Gold retreats modestly after failing to sustain gains despite fall in US Treasury yields, weaker US Dollar. XAU/USD struggles to capitalize following release of weaker-than-expected S&P Global PMIs, fueling speculation about potential Fed rate cuts.
Ethereum ETF issuers not giving up fight, expert says as Grayscale files S3 prospectus

Ethereum exchange-traded funds theme gained steam after the landmark approval of multiple BTC ETFs in January. However, the campaign for approval of this investment alternative continues, with evidence of ongoing back and forth between prospective issuers and the US SEC.
US versus the Eurozone: Inflation divergence causes monetary desynchronization

Historically there is a very close correlation between changes in US Treasury yields and German Bund yields. This is relevant at the current juncture, considering that the recent hawkish twist in the tone of the Fed might continue to push US long-term interest rates higher and put upward pressure on bond yields in the Eurozone.