EUR/USD Current price: 1.1348
View Live Chart for the EUR/USD

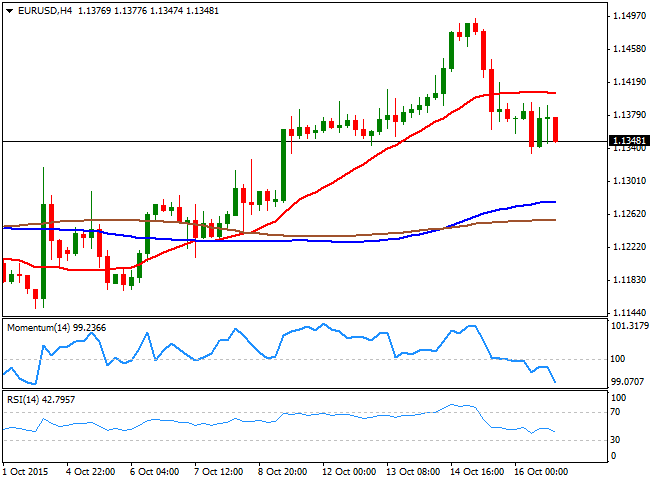
The American dollar recovered some ground last Friday, ending the week pretty much unchanged against its European rival, around 1.1350. In Europe, macroeconomic readings showed that the EU inflation during September posted a slight increase compared to August one, matching expectations at 0.2% monthly basis. Euro area annual inflation was -0.1% in September 2015, down from 0.1% in August. US data, on the other hand, was generally positive, as the number of job openings decreased to 5.4 million in August, a little weaker than expectations, but still at high levels. Consumer sentiment climbed more than forecast in October, with the University of Michigan’s preliminary consumer sentiment index up to 92.1, the first advance in four months.
From a technical point of view, the EUR/USD pair maintains a positive tone daily basis, although failure at 1.1500 earlier in the week suggests a limited upward potential ahead. Nevertheless, the price holds well above its moving averages, with the 20 DMA acting as a critical support around 1.1280 for the upcoming days, whilst the technical indicators hold well above their mid-lines, albeit lacking upward momentum at the time being. Shorter term, the 4 hours chart presents a bearish tone, with the price having been unable to advance beyond its 20 SMA since last Wednesday, and the technical indicators maintaining strong bearish slopes in negative territory. Friday's low at 1.1330 provides an immediate support, with a break below it required to confirm a bearish continuation for this Monday.
Support levels: 1.1330 1.1280 1.1240
Resistance levels: 1.1375 1.1420 1.1460
EUR/JPY Current price: 135.56
View Live Chart for the EUR/JPY
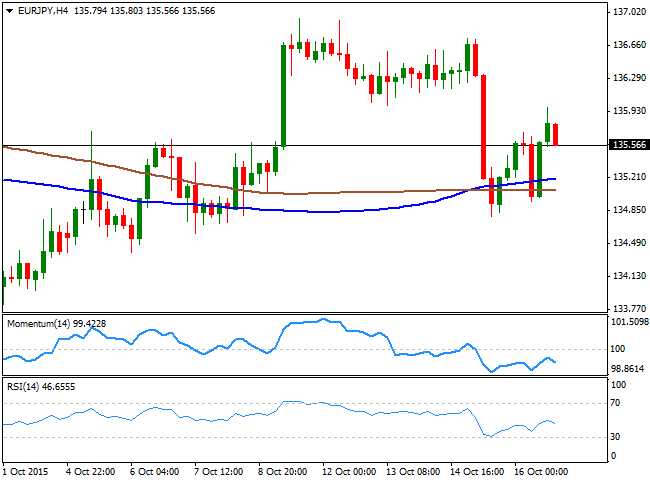
The EUR/JPY pair edged slightly higher on Friday, although negative in the week at 135.56. The Japanese yen gave back some ground as stocks closed higher in the US for a third week in-a-row, sending investors way from safe haven assets. The daily chat shows that the pair continues trading within a large symmetrical triangle, without not a clear trend ever since late July. In the same chart, the pair met selling interest around its 100 DMA at 135.92, the immediate resistance, but held above the 200 DMA, now at 134.46. Both moving averages are horizontal, reflecting the lack of directional strength. In the same chart, the technical indicators have bounced from their mid-lines, and maintain tepid bullish slopes. In the 4 hours chart, however, the technical indicators have been rejected from their mid-lines and head south, whilst the 100 and 200 SMAs hover around 135.00/10.
Support levels: 135.10 134.70 134.10
Resistance levels: 135.90 136.40 136.90
GBP/USD Current price: 1.5438
View Live Chart for the GPB/USD
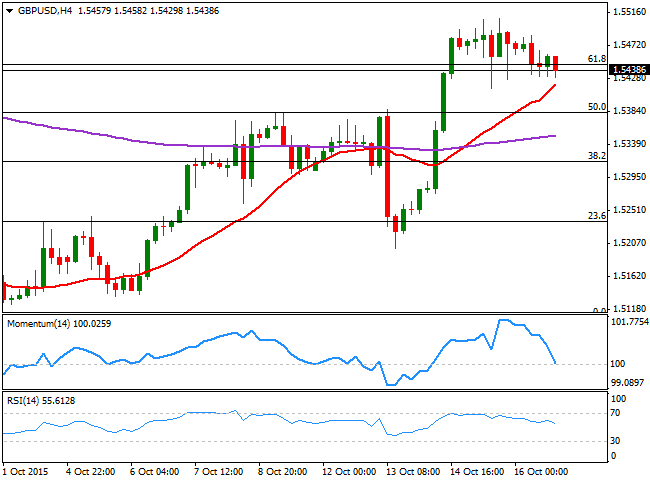
The British Pound gave back some ground on Friday, but closed the week with solid gains against the greenback, around 1.5440. The GBP turned sharply higher after local data showed that while inflation turned negative in September, wages surged. The combination of both may result in a boost in consumption for the upcoming months, which at the end will mean a continued improvement in the economic situation, and lead for a rate hike. There will be no relevant fundamental releases in the UK until next Thursday, when Britain will publish its Retail Sales data for September. In the meantime, the daily chart shows that the price is a couple of pips below the 61.8% retracement of its latest daily fall, whilst the technical indicators have lost their upward strength, but hold well into positive territory, and that the price is far above its 20 SMA. In the 4 hours chart, the Momentum indicator has turned sharply lower from overbought levels, and is about to cross its mid-line towards the downside, although the 20 SMA maintains a strong bullish slope around 1.5420, whilst the RSI indicator heads slightly lower around 55. A downward corrective movement may extend down to 1.5380, the 50% retracement of the mentioned rally, where buying interest will likely surge.
Support levels: 1.5420 1.5380 1.5335
Resistance levels: 1.5445 1.5495 1.5530
USD/JPY Current price: 119.45
View Live Chart for the USD/JPY
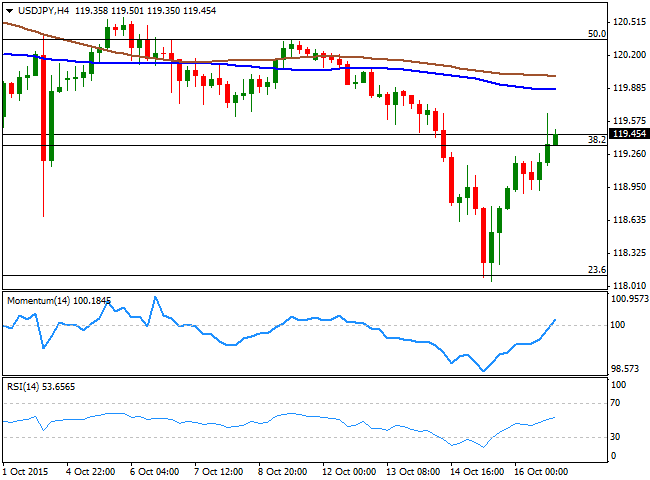
The USD/JPY pair has staged a strong comeback by the ends of the last week, recovering from a 2-month low of 118.05. The pair has reentered its latest range, although the negative tone persists according to the daily chart, as the technical indicators remain below their mid-lines, having however, lost their negative slopes and turned higher. In the same chart, the 100 DMA presents a mild bearish slope above the 200 DMA, both far above the current level. Shorter term, the 4 hours chart shows that the technical indicators head sharply lower above their mid-lines, having maintained the positive tone ever since bottoming in extreme oversold levels. In this last chart however, the price is also well below its 100 and 200 SMAs, limiting chances of a stronger rally beyond 120.00. Currently trading a few pips above 119.35, the immediate Fibonacci support, a downward acceleration below the level should see the pair resuming the bearish momentum seen last week, with the pair then heading back to the mentioned 2-month low, the 23.6% retracement of the latest weekly decline.
Support levels: 119.35 118.90 118.55
Resistance levels: 119.70 120.00 120.35
AUD/USD Current price: 0.7267
View Live Chart for the AUD/USD
The AUD/USD pair shed ground on Friday, ending the week in the red at 0.7267, and having been under pressure ever since the day started. Weaker gold prices and rising stocks weighed on the commodity-related currency, but the Aussie suffered the most with the release of the RBA Financial Stability Report, which fueled speculation the Central Bank may cut rates further before the year end. At the beginning of this Monday, China will release its GDP figures, and the expectations are for a decline to 6.8% YoY in the third quarter, from a previous 7.% Should the decline surpass expectations, the Australian dollar will likely extend its decline towards the 0.7200 level, the next critical support. Technically, the daily chart shows that the technical indicators are retreating from overbought levels, but at the same time, the price is well above a bullish 20 SMA, currently around 0.7150. In the 4 hours chart, the price has broken below a now bearish 20 SMA, whilst the technical indicators head lower around their mid-lines, in line with additional declines, particularly on a break below 0.7240, the immediate support.
Support levels: 0.7240 0.7210 0.7170
Resistance levels: 0.7290 0.7335 0.7380
Information on these pages contains forward-looking statements that involve risks and uncertainties. Markets and instruments profiled on this page are for informational purposes only and should not in any way come across as a recommendation to buy or sell in these assets. You should do your own thorough research before making any investment decisions. FXStreet does not in any way guarantee that this information is free from mistakes, errors, or material misstatements. It also does not guarantee that this information is of a timely nature. Investing in Open Markets involves a great deal of risk, including the loss of all or a portion of your investment, as well as emotional distress. All risks, losses and costs associated with investing, including total loss of principal, are your responsibility. The views and opinions expressed in this article are those of the authors and do not necessarily reflect the official policy or position of FXStreet nor its advertisers. The author will not be held responsible for information that is found at the end of links posted on this page.
If not otherwise explicitly mentioned in the body of the article, at the time of writing, the author has no position in any stock mentioned in this article and no business relationship with any company mentioned. The author has not received compensation for writing this article, other than from FXStreet.
FXStreet and the author do not provide personalized recommendations. The author makes no representations as to the accuracy, completeness, or suitability of this information. FXStreet and the author will not be liable for any errors, omissions or any losses, injuries or damages arising from this information and its display or use. Errors and omissions excepted.
The author and FXStreet are not registered investment advisors and nothing in this article is intended to be investment advice.
Recommended Content
Editors’ Picks
AUD/USD remains under pressure above 0.6400

AUD/USD managed to regain some composure and rebounded markedly from Tuesday’s YTD lows in the sub-0.6400 region ahead of the release of the Australian labour market report on Thursday.
EUR/USD holds above 1.0650 amid renewed selling pressure in US Dollar

The EUR/USD pair edges higher to 1.0672 on Thursday during the early Asian session. The recovery of that major pair is bolstered by renewed selling pressure in the US Dollar and a risk-friendly environment.
Gold retreats as lower US yields offset the impact of hawkish Powell speech

Gold prices retreated from close to weekly highs during the North American session on Wednesday amid an improvement in risk appetite. The bullish impulse arrived despite hawkish commentary by US Federal Reserve officials.
Bitcoin price uptrend to continue post-halving, Bernstein report says as traders remain in disarray

Bitcoin price is dropping amid elevated risk levels in the market. It comes as traders count hours to the much-anticipated halving event. Amid the market lull, experts say we may not see a rally until after the halving.
Australia unemployment rate expected to rise back to 3.9% in March as February boost fades

Australia will publish its monthly employment report first thing Thursday. The Australian Bureau of Statistics is expected to announce the country added measly 7.2K new positions in March after the outstanding 116.5K jobs created in February.