EUR/USD Current price: 1.1179
View Live Chart for the EUR/USD
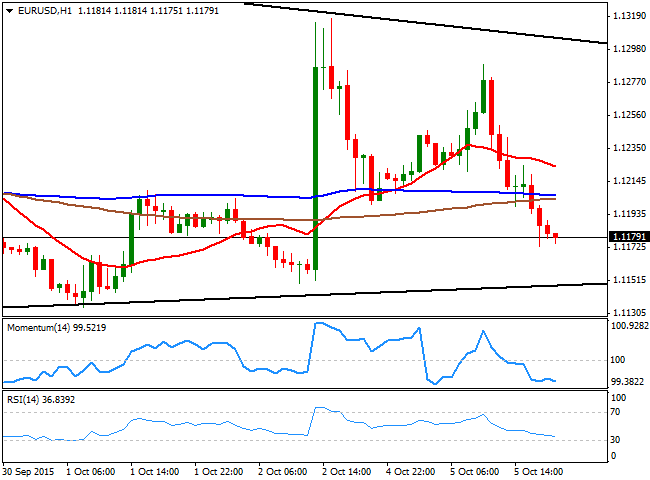
The EUR/USD pair advanced up to 1.1288 during the European opening, but gave up over 100 pips afterwards, with no certain catalyst behind the move, but a steady advance in worldwide stocks. Investors continued trading in the light of the latest US NFP report, as the poor result of the country's inflation figures of September, fueled speculation that the Federal Reserve won't be able to raise rates this 2015. As for macroeconomic data, figures were soft both in Europe and the US, with the services PMI readings missing expectations. The services´ sector posted a limited growth in the EU according to the Markit survey, down to 53.7 from previous 54. In the US, the final reading came out at 56.9 against previous 59.0.
Technically, and in the short term, the pair has turned bearish, as in the 1 hour chart, the price has returned below its moving averages, whilst the technical indicators maintain their strong bearish slopes well below their mid-lines. In the 4 hours chart, the pair points to close the day below a still flat 20 SMA, whilst the technical indicators turned sharply lower and crossed their mid-lines towards the downside, pointing for a test of the base of its latest range in the 1.1100/20 price zone.
Support levels: 1.1160 1.1120 1.1080
Resistance levels: 1.1200 1.1245 1.1290
EUR/JPY Current price: 134.65
View Live Chart for the EUR/JPY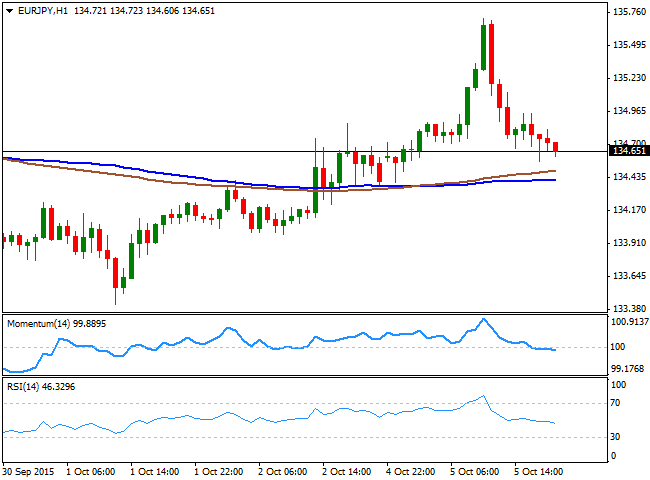
The EUR/JPY advanced up to 135.71 intraday, boosted by EUR gains and a weak JPY, pressured by the continued advance in stocks. The pair however, retreated alongside with the EUR/USD, erasing all of its intraday gains. Technically, the 1 hour chart shows that the technical indicators head lower below their mid-lines, coming from overbought levels, whilst the 100 and 200 SMAs remain in a tight 20 pips range in the 134.30/50 region, offering an immediate intraday support. In the 4 hours chart, the technical indicators are biased lower, but still above their mid-lines, whilst the price remains below their moving averages. A continued decline through the 134.40 level should lead to a retest of the 133.30 price zone, with the upside still seen limited by selling interest on spikes.
Support levels: 134.00 133.65 133.30
Resistance levels: 134.95 135.40 135.90
GBP/USD Current price: 1.5147
View Live Chart for the GPB/USD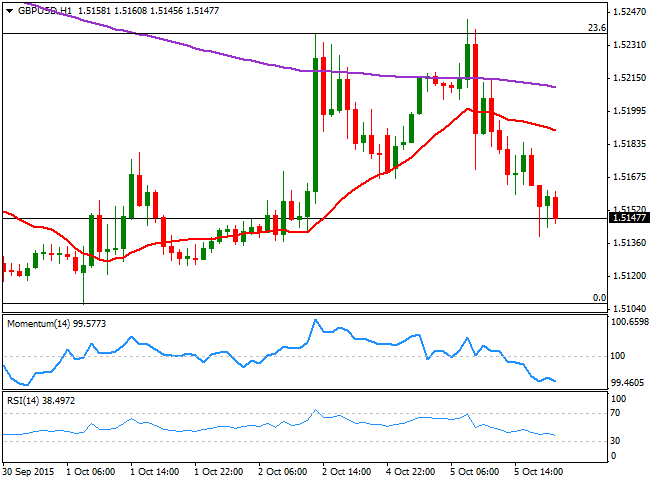
The British Pound advanced up to 1.5247 against its American rival at the beginning of the European session, where the pair met selling interest around the 23.6% retracement of its latest daily decline. The initial decline was triggered by the poor UK Markit Services PMI, down to 53.3 in September from previous 55.6. So far, the sector has been leading the local economic recovery, and the negative number, which is the lowest in over two and a half years, fueled concerns over the health of the UK economy. Technically, the 1 hour chart shows that the technical indicators maintain their sharp negative tone, despite being near oversold levels, whilst the 20 SMA has turned lower, now converging with the strong static resistance level at 1.5200. In the 4 hours chart, the price is now below a horizontal 20 SMA, whilst the technical indicators are crossing their mid-lines towards the downside, supporting a continued decline towards the 1.5100 region, which if broken, could see the pair extending its decline down to the 1.5000 level.
Support levels: 1.5130 1.5100 1.5060
Resistance levels: 1.5160 1.5200 1.5235
USD/JPY Current price: 120.46
View Live Chart for the USD/JPY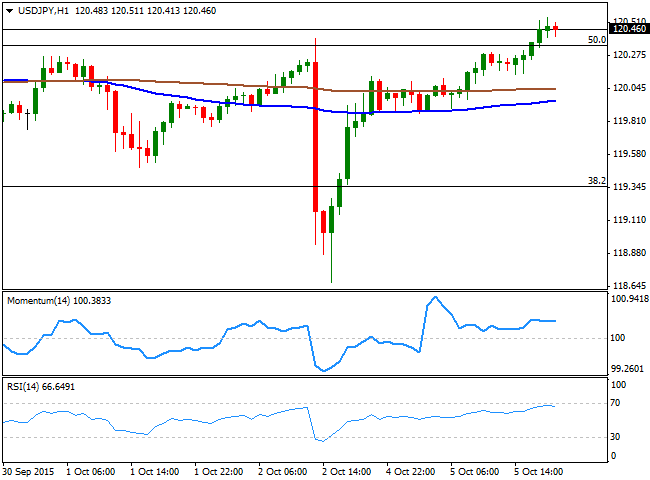
The USD/JPY posted a slow, but steady intraday advance, breaking above the 120.35 Fibonacci level during the American afternoon, helped by the continued gains in the US stocks' market. Also, supporting the pair are US 10y treasury yields, up to 2.06%, daily basis. The 1 hour chart shows that the price is now above its 100 and 200 SMAs, both still flat around the 120.00 region, whilst the technical indicators remain flat in positive territory. In the 4 hours chart, the price is above its moving averages, whilst the technical indicators head higher above their mid-lines, supporting additional advances as long as the price holds above 120.35, the 50% retracement of the latest weekly decline and the immediate support. Additional gains beyond 120.70 the immediate resistance, should lead to a test of the top of the latest range at 121.35, the 61.8% retracement of the same rally.
Support levels: 120.35 120.00 119.60
Resistance levels: 120.70 121.00 121.35
AUD/USD Current price: 0.7090
View Live Chart for the AUD/USD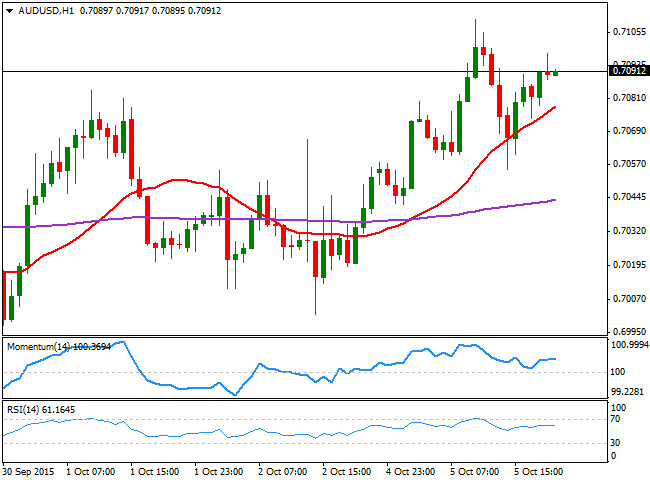
The AUD/USD pair advanced up to 0.7110 at the beginning of this week, finding support in strong commodities' prices. The pair retreated from the level, down to 0.7055 before recovering back towards its high, amid rising stocks. The short term picture is bullish, as the 1 hour chart shows that the price is well above a bullish 20 SMA, although the technical indicators have lost their bullish strength, still holding above their mid-lines. In the 4 hours chart, the upward potential is also clear, as the 20 SMA heads sharply higher, currently around 0.7050, whilst the Momentum indicator heads sharply higher well above its 100 level and the RSI indicator consolidates around 59. In this last chart, the 200 EMA stands around the mentioned daily high of 0.7110, and a break above it should confirm additional gains, pointing to an approach to the 0.7200 price zone later on in the day.
Support levels: 0.7050 0.7020 0.6980
Resistance levels: 0.7110 0.7140 0.7190
Information on these pages contains forward-looking statements that involve risks and uncertainties. Markets and instruments profiled on this page are for informational purposes only and should not in any way come across as a recommendation to buy or sell in these assets. You should do your own thorough research before making any investment decisions. FXStreet does not in any way guarantee that this information is free from mistakes, errors, or material misstatements. It also does not guarantee that this information is of a timely nature. Investing in Open Markets involves a great deal of risk, including the loss of all or a portion of your investment, as well as emotional distress. All risks, losses and costs associated with investing, including total loss of principal, are your responsibility. The views and opinions expressed in this article are those of the authors and do not necessarily reflect the official policy or position of FXStreet nor its advertisers. The author will not be held responsible for information that is found at the end of links posted on this page.
If not otherwise explicitly mentioned in the body of the article, at the time of writing, the author has no position in any stock mentioned in this article and no business relationship with any company mentioned. The author has not received compensation for writing this article, other than from FXStreet.
FXStreet and the author do not provide personalized recommendations. The author makes no representations as to the accuracy, completeness, or suitability of this information. FXStreet and the author will not be liable for any errors, omissions or any losses, injuries or damages arising from this information and its display or use. Errors and omissions excepted.
The author and FXStreet are not registered investment advisors and nothing in this article is intended to be investment advice.
Recommended Content
Editors’ Picks
AUD/USD stands firm above 0.6500 with markets bracing for Aussie PPI, US inflation

The Aussie Dollar begins Friday’s Asian session on the right foot against the Greenback after posting gains of 0.33% on Thursday. The AUD/USD advance was sponsored by a United States report showing the economy is growing below estimates while inflation picked up. The pair traded at 0.6518.
EUR/USD mired near 1.0730 after choppy Thursday market session

EUR/USD whipsawed somewhat on Thursday, and the pair is heading into Friday's early session near 1.0730 after a back-and-forth session and complicated US data that vexed rate cut hopes.
Gold soars as US economic woes and inflation fears grip investors

Gold prices advanced modestly during Thursday’s North American session, gaining more than 0.5% following the release of crucial economic data from the United States. GDP figures for the first quarter of 2024 missed estimates, increasing speculation that the US Fed could lower borrowing costs.
Bitcoin price continues to get rejected from $65K resistance as SEC delays decision on spot BTC ETF options

Bitcoin (BTC) price has markets in disarray, provoking a broader market crash as it slumped to the $62,000 range on Thursday. Meanwhile, reverberations from spot BTC exchange-traded funds (ETFs) continue to influence the market.
Bank of Japan expected to keep interest rates on hold after landmark hike

The Bank of Japan is set to leave its short-term rate target unchanged in the range between 0% and 0.1% on Friday, following the conclusion of its two-day monetary policy review meeting for April. The BoJ will announce its decision on Friday at around 3:00 GMT.