EUR/USD Current price: 1.1201
View Live Chart for the EUR/USD
The American closed the day modestly higher across the board, with stocks volatility and Central Banks in the eye of the storm. During Asian hours, stocks soared with the Nikkei 225 rallying over 1,340 points, which led to a strong opening amongst European equities. US futures traded also sharply higher, but with little macroeconomic data around, and attention focusing on a US possible rate hike, and more easing chatter in Asia, stocks faded the rally and ended the day with losses. In the US, The number of job openings rose to a record high of 5.8 million on the last business day of July, according to the US Bureau of Labor Statistics, fueling hopes that the FED's may begin raising its rates as soon as next September 17th.
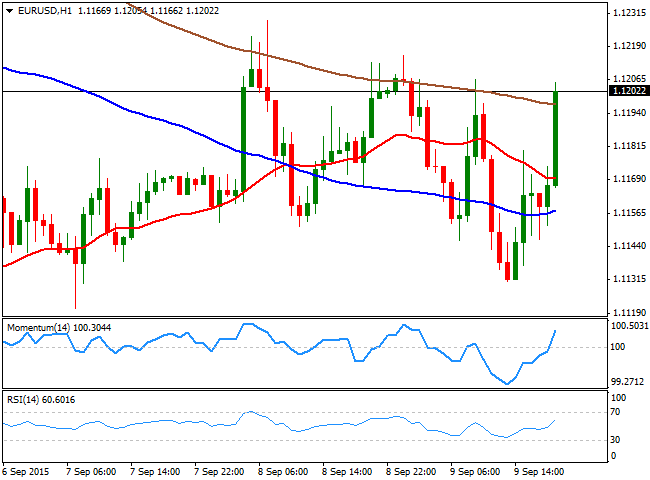
The EUR/USD pair traded as low as 1.1131 at the beginning of the American session, from where it slowly bounced back to close the day near the 1.1200 level. The early attempts to break through the figure have been short lived, with sellers still aligned in the 1.1200/40 region. Technically, the 1 hour chart shows that the price is now above its 20 SMA that anyway maintains a bearish slope, whilst the technical head higher above their mid-lines, supporting an approach to the mentioned selling area. In the 4 hours chart, the pair maintains a neutral stance, with the technical indicators barely bouncing from their mid-lines, and the price moving back and forth around a flat 20 SMA. The pair may extend its advance later on this Thursday, yet it will take a steady advance beyond 1.1280, the 61.8% retracement of its latest decline, to confirm a more constructive outlook.
Support levels: 1.1160 1.1120 1.1080
Resistance levels: 1.1240 1.1280 1.1330
EUR/JPY Current price: 135.00
View Live Chart for the EUR/JPY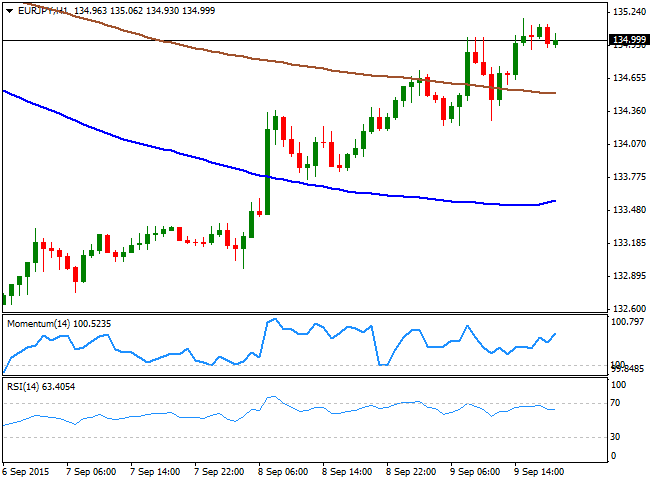
The EUR/JPY extended its latest rally up to 135.18, with the Japanese yen under pressure ever since the day started, weighed by a sudden change in markets' sentiment. Also favoring yen's decline were comments from Prime Minister Shinzo Abe who announced a tax cut as the slow recovery in the country continues to weigh. Technically, the 1 hour chart shows that the price has managed to extend above its 200 SMA whilst the technical indicators are now regaining upward strength well into positive territory, supporting additional gains ahead. In the 4 hours chart, the technical indicators are giving their first signs of upward exhaustion near overbought territory, but still far from suggesting a downward acceleration. In this last time frame, the pair continues trading below its 100 and 200 SMAs, which maintains further long term gains still unclear. The pair has an immediate resistance around 135.30, where it presents several intraday highs and lows, with a break above it now required to confirm a bullish continuation for the upcoming sessions.
Support levels: 134.65 134.20 133.70
Resistance levels: 135.30 135.80 136.40
GBP/USD Current price: 1.5367
View Live Chart for the GPB/USD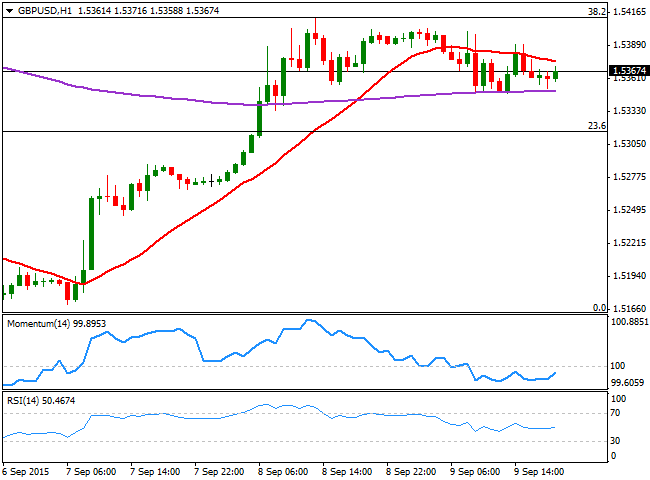
The GBP/USD pair edged lower after two days of steady gains, as UK data disappointed big ahead of the upcoming BOE's policy economic meeting early Thursday. The NIESR GDP estimate pointing for a 0.5% growth in the three months ending in August 2015, below the previous reading of 0.7%. Earlier in the day, Industrial Manufacturing and Production unexpectedly shrunk in July, whilst the trade deficit in goods and services grew to £3.4 billion in July 2015, over £2.6 billion more than the month before. The pair fell down to 1.5347, where short term buying interest surged, triggering some shallow intraday bounces. The BOE is largely expected to keep its economic policy unchanged, and investors will be focusing on any clues about the timing of a rate hike in the UK, although the consensus points for a dovish outcome, given the ongoing turmoil coming from China. In the meantime, the short term picture shows that the downside is still limited, as in the 1 hour chart, the technical indicators aim higher, still below their mid-lines, while the 20 SMA contains the upside now around 1.5380. In the 4 hours chart, the Momentum indicator grinds lower from overbought levels, but the RSI indicator regained the upside and heads north around 60.
Support levels: 1.5350 1.5315 1.5260
Resistance levels: 1.5410 1.5450 1.5490
USD/JPY Current price: 120.58
View Live Chart for the USD/JPY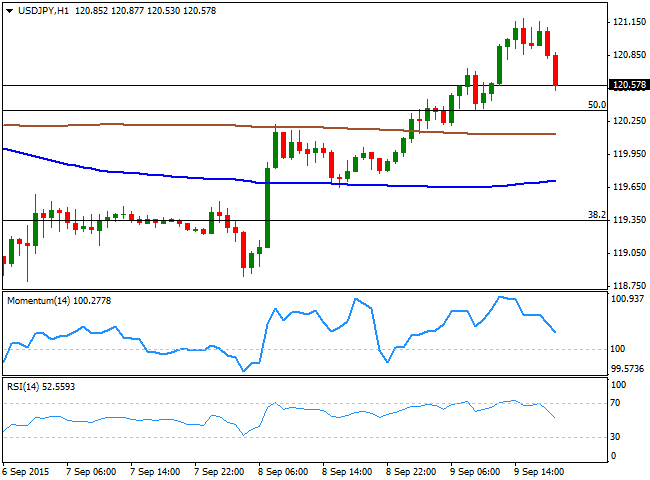
The USD/JPY pair advanced to a fresh weekly high of 121.19, boosted by the early upward momentum in worldwide stocks, and the announcement made by Japan’s Prime Minister Shinzo Abe, who declared that the effective corporate tax rate of about 35% will be cut by next year by at least 3.3%. The ongoing deflation in the country along with this new stimulus measures, fuel speculation of more stimulus ahead in the country, supporting the intraday rally. The pair, however, turned sharply lower mid American afternoon, as Wall Street erased all of its intraday gains and accelerated its decline once entering into the red. The 1 hour chart shows that the technical indicators turned sharply lower from overbought levels and are now approaching their mid-lines, whilst the 100 and 200 SMAs, are horizontal, well below the current price. In the 4 hours chart, the technical indicators have also turned lower from near overbought levels, whilst the price is back below a bearish 100 SMA. The pair has a critical resistance area between 121.20/35, where the pair has its 200 DMA and the 61.8% retracement of its latest slump, and it will take a break above it to confirm another leg higher for the upcoming sessions.
Support levels: 120.35 120.00 119.60
Resistance levels: 120.95 121.35 121.80
AUD/USD Current price: 0.7017
View Live Chart for the AUD/USD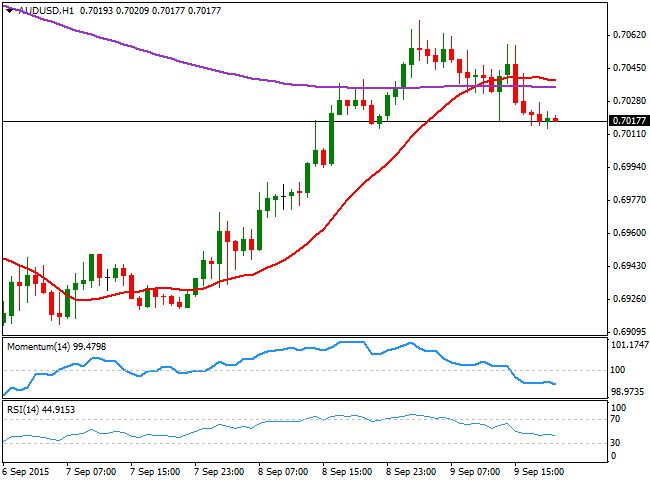
The Aussie rallied on relief during the previous Asian session, extending against the greenback to a daily high of 0.7069, from where it slowly turned lower, to post a daily low of 0.7014 by the end of the American session. Later on today, Australia will release its monthly employment figures for August, with the unemployment rate expected to tick lower to 6.2% and around 5,000 new jobs added in the month. The report tends to trigger sharp intraday moves that are not always sustainable afterwards, so waiting for the market to digest the news is highly recommended. Trading a few pips below its daily opening, the pair presents a short term bearish tone, as the 1 hour chart shows that the price is now below a bearish 20 SMA, whilst the technical indicators hold well into negative territory. In the 4 hours chart, however, the technical indicators are aiming to recover the upside after correcting overbought readings, whilst the 20 SMA heads higher around 0.6970, limiting the downside.
Support levels: 0.7000 0.6965 0.6930
Resistance levels: 0.7040 0.7090 0.7135
Recommended Content
Editors’ Picks
EUR/USD clings to daily gains above 1.0650

EUR/USD gained traction and turned positive on the day above 1.0650. The improvement seen in risk mood following the earlier flight to safety weighs on the US Dollar ahead of the weekend and helps the pair push higher.
GBP/USD recovers toward 1.2450 after UK Retail Sales data

GBP/USD reversed its direction and advanced to the 1.2450 area after touching a fresh multi-month low below 1.2400 in the Asian session. The positive shift seen in risk mood on easing fears over a deepening Iran-Israel conflict supports the pair.
Gold holds steady at around $2,380 following earlier spike

Gold stabilized near $2,380 after spiking above $2,400 with the immediate reaction to reports of Israel striking Iran. Meanwhile, the pullback seen in the US Treasury bond yields helps XAU/USD hold its ground.
Bitcoin Weekly Forecast: BTC post-halving rally could be partially priced in Premium

Bitcoin price shows no signs of directional bias while it holds above $60,000. The fourth BTC halving is partially priced in, according to Deutsche Bank’s research.
Week ahead – US GDP and BoJ decision on top of next week’s agenda

US GDP, core PCE and PMIs the next tests for the Dollar. Investors await BoJ for guidance about next rate hike. EU and UK PMIs, as well as Australian CPIs also on tap.