EUR/USD Current price: 1.1149
View Live Chart for the EUR/USD
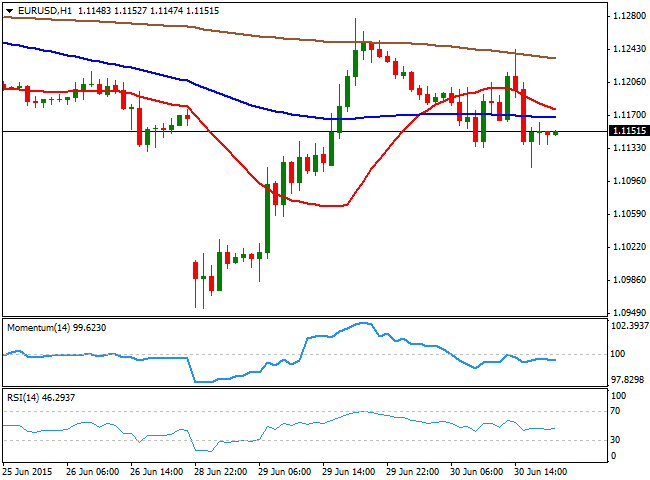
The common currency gave back part of its Monday's gains, ending the day around the 1.1150 level against the greenback, after another round of speculations and rumors surrounding Greece. The day started with tepid data coming from Europe, as German Retail sales grew 0.5% in May compared to a month before, but the annual reading resulted at -0.4% against expectations of a 2.5% raise. Unemployment in the country fell less than expected in June, whilst annual inflation in the EU matched expectations of 0.2%. Nevertheless, the market was all about the Greek drama, with the default of the country on the IMF driving the pair down to 1.1133 earlier in the day. As the day developed, news shown that Athens submitted a request to the ESM for a two-year agreement to cover the country’s financing needs and including a debt restructuring at the same time, but German Chancellor Angela Merkel opposed talking up a deal before the July 5th referendum.
The pair sunk by London close down to 1.1111, maintaining a heavy tone in the short term, ahead of the Asian opening. The 1 hour chart shows that the intraday recovery was again contained by the 200 SMA, whilst the 20 SMA turned lower above the current price and that the technical indicators present mild bearish slopes below their mid-lines. In the 4 hours chart, however, the price is barely below its 20 SMA, whilst the moving averages continue to hover around their mid-lines, lacking directional strength at the time being.
Support levels: 1.1120 1.1080 1.1050
Resistance levels: 1.1160 1.1210 1.1245
EUR/JPY Current price: 136.36
View Live Chart for the EUR/JPY
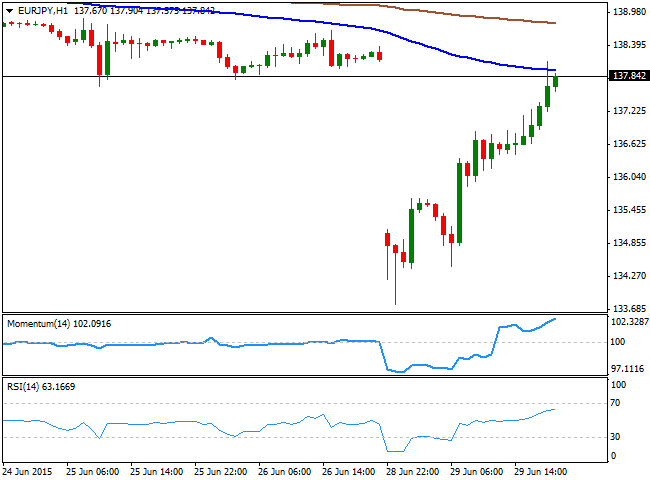
The Japanese yen advanced against the common currency, with the EUR/JPY closing the day around 136.30, mostly on EUR weakness. The 1 hour chart shows that the pair found sellers around a bearish 100 SMA, currently around 137.40, while the technical indicators stand below their mid-lines, lacking directional momentum. In the 4 hours chart, the downside is also favored, as the price holds below its moving averages, whilst the RSI indicator anticipated additional declines around 39 and the Momentum indicator holds flat below the 100 level. A break below 135.80, the daily low, is required to confirm a downward continuation in the pair down to the 134.90/135.00 price zone.
Support levels: 135.80 135.35 134.90
Resistance levels: 136.40 136.90 137.50
GBP/USD Current price: 1.5732
View Live Chart for the GBP/USD
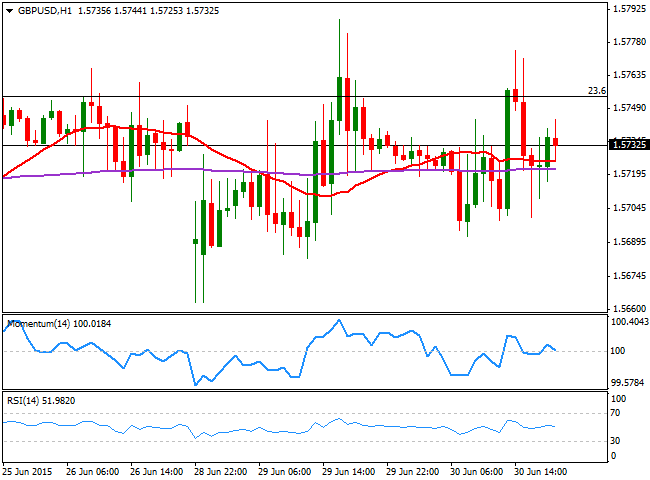
The British Pound continues to trade range bound against its American data, despite encouraging UK GDP figures: the economy grew more than initially estimated, up to 0.4% from previous 0.3% in the first quarter of this 2015. The pair surged briefly up to 1.5774 on speculation that negotiations resumed in Europe, but was unable to sustain gains above the 1.5750 Fibonacci figure. In fact, the pair has posted a lower high daily basis, suggesting selling interest on advances is still strong. Technically, the 1 hour chart shows that the price hovers around a flat 20 SMA, whilst the technical indicators show no directional momentum in neutral territory. In the 4 hours chart, the technical picture is also neutral, as the technical indicators are unable to move away from their mid-lines. The critical support continues to be 1.5645, the 38.2% retracement of the 1.5189/1.5929 daily run, and it will take a break below it to confirm a new leg lower, towards the 1.5550 price zone, 50% retracement of the same rally.
Support levels: 1.5695 1.5645 1.5610
Resistance levels: 1.5750 1.5795 1.5830
USD/JPY Current price: 122.26
View Live Chart for the USD/JPY
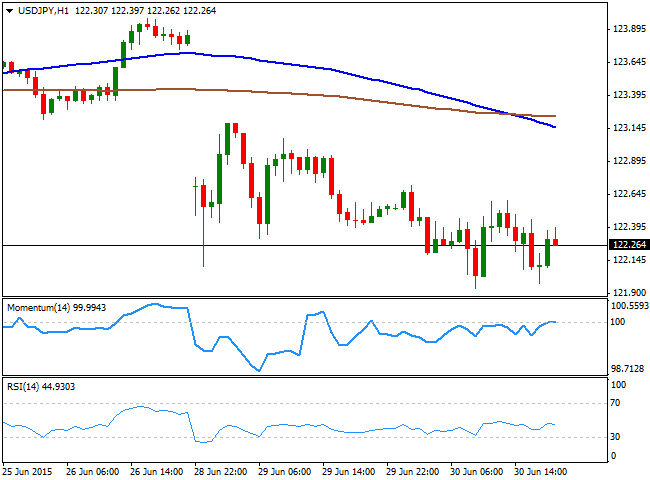
The USD/JPY fell down to 122.10 intraday, still under pressure on the yen's safe-haven condition. The pair however, should trade in a more limited range now, ahead of the release of the US Nonfarm Payroll report next Thursday. Anyway, the short term picture favors additional declines, as in the 1 hour chart, the 100 SMA crossed below the 200 SMA well above the current level, whilst the technical indicators are retreating from their mid-lines, after failing to recover above them. In the 4 hours chart, the Momentum indicator heads sharply lower in negative territory, whilst the RSI aims lower around 35 as the price remains below its moving averages, all of which supports the shorter term view. A downward acceleration below the 122.00 level should lead to a quick decline down to 121.60, whilst below this last, 121.20, the 100 DMA comes as the next probable bearish target.
Support levels: 122.00 121.60 121.20
Resistance levels: 122.90 123.30 123.75
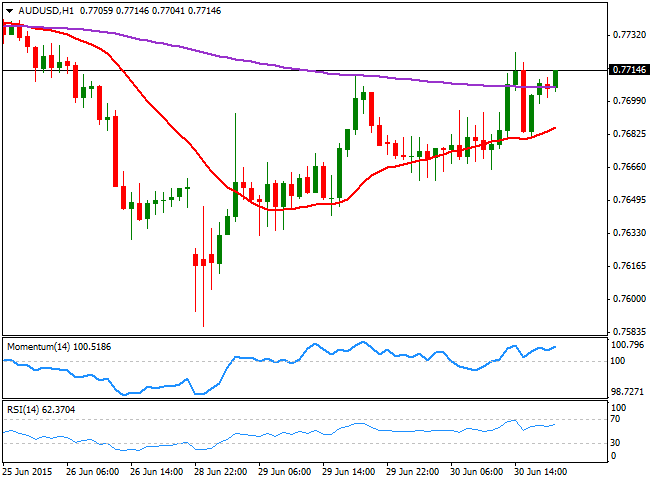
AUD/USD Current price: 0.7710
View Live Chart for the AUD/USD
The Australian dollar advanced for a second day in-a-row against its American rival, and the AUD/USD pair advanced above the 0.7700 figure by the US close. The Aussie was on demand ever since the day started on NZD weakness, although the latest rally needs to survive the upcoming releases of Chinese PMIs during the Asian session. If the figures result disappointing the AUD will likely give back its latest gains. Technically, the 1 hour chart shows that the price has found support in a mild bullish 20 SMA, currently around 0.7690, while the technical indicators are losing their upward strength near overbought levels. In the 4 hours chart, the price advanced well above a still bearish 20 SMA, whilst the technical indicators are also losing their upward strength above their mid-lines. In this last time frame, the 200 EMA stands at 0.7750, offering a strong dynamic resistance in the case of a new leg up.
Support levels: 0.7690 0.7640 0.7590
Resistance levels: 0.7720 0.7750 0.7780
Recommended Content
Editors’ Picks
EUR/USD holds gains near 1.0650 amid risk reset

EUR/USD is holding onto its recovery mode near 1.0650 in European trading on Friday. A recovery in risk sentiment is helping the pair, as the safe-haven US Dollar pares gains. Earlier today, reports of an Israeli strike inside Iran spooked markets.
GBP/USD recovers toward 1.2450 after UK Retail Sales data

GBP/USD is rebounding toward 1.2450 in early Europe on Friday, having tested 1.2400 after the UK Retail Sales volumes stagnated again in March, The pair recovers in tandem with risk sentiment, as traders take account of the likely Israel's missile strikes on Iran.
Gold price defends gains below $2,400 as geopolitical risks linger

Gold price is trading below $2,400 in European trading on Friday, holding its retreat from a fresh five-day high of $2,418. Despite the pullback, Gold price remains on track to book the fifth weekly gain in a row, supported by lingering Middle East geopolitical risks.
Bitcoin Weekly Forecast: BTC post-halving rally could be partially priced in Premium

Bitcoin price shows no signs of directional bias while it holds above $60,000. The fourth BTC halving is partially priced in, according to Deutsche Bank’s research.
Geopolitics once again take centre stage, as UK Retail Sales wither

Nearly a week to the day when Iran sent drones and missiles into Israel, Israel has retaliated and sent a missile into Iran. The initial reports caused a large uptick in the oil price.
