EUR/USD Current price: 1.0926
View Live Chart for the EUR/USD
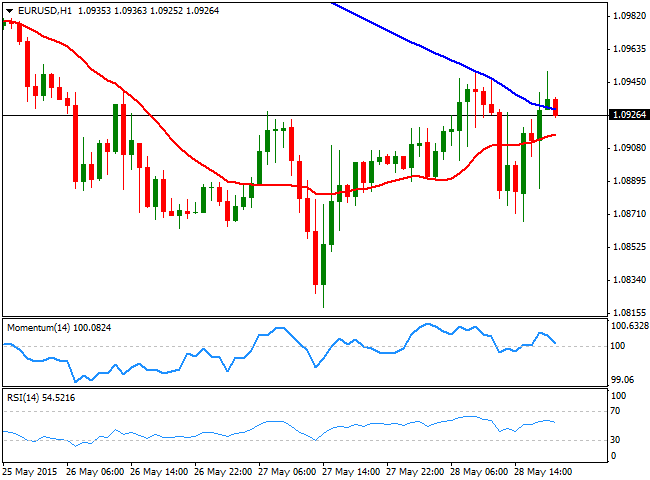
The EUR/USD pair traded marginally higher this Thursday, advancing up to the 1.0950 region and ending the day nearby, despite intraday selling interest have surged repeatedly around the level. In the news front, the calendar in Europe was light, with the attention centered once in Greece. As the hours went by with no news on the alleged deal, investors dropped the common currency sending the pair down to 1.0866, from where it recovered after mixed US data showed that weekly unemployment claims resulted worse-than-expected printing 282K in the week ending May 22nd, and US Pending Home Sales climbed to its highest since May 2006. Later in the American afternoon, IMF’s Lagarde said that a Grexit is possibility, whilst an EU official warned there will be no deal this week, considering the strong disagreements on pensions and sales tax. Nevertheless, the dollar remained subdued as investors took some profits out of the table ahead of Friday's GDP second release, expected with a strong downward revision for the Q1.
The EUR/USD technical picture shows that the downward risk prevails, as in the 1 hour chart, the price is unable to advance beyond its 10 SMA, whilst the technical indicators have turned south, but remain in positive territory. In the 4 hours chart, the Momentum indicator has turned horizontal around the 100 level, whilst the RSI aims slightly higher around 44, whilst the price struggles around a bearish 20 SMA, all of which supports the dominant bearish trend that will anyway depend on the result of US GDP revisions.
Support levels: 1.0900 1.0860 1.0810
Resistance levels: 1.0930 1.0960 1.1000
EUR/JPY Current price: 135.42
View Live Chart for the EUR/JPY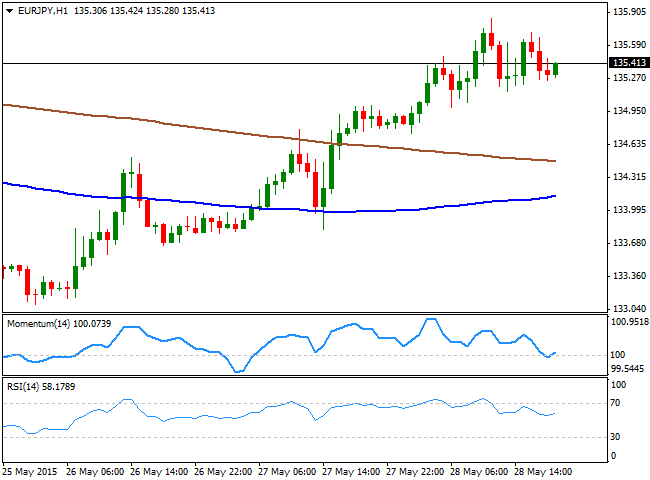
The EUR/JPY reached a fresh weekly high of 135.84, on a steadily weak Japanese Yen that got help from Haruhiko Kuroda, Bank of Japan governor, who said that they are not concerned over a possible bubble in the stock market, and that the Central Bank is still fighting to reach its 2% inflation target. The short term technical picture is bullish, with the price advancing above its 100 and 200 SMAs, and with the shortest approaching the largest from below, whilst the technical indicators have bounced around their mid-lines and head now north. In the 4 hours chart, however, the technical indicators are losing their upward strength well above their mid-lines, pointing for a downward corrective movement, probably towards the 135.00 level. Should this last hold, the downside will remain limited.
Support levels: 135.00 134.40 133.90
Resistance levels: 135.85 136.30 136.80
GBP/USD Current price: 1.5302
View Live Chart for the GBP/USD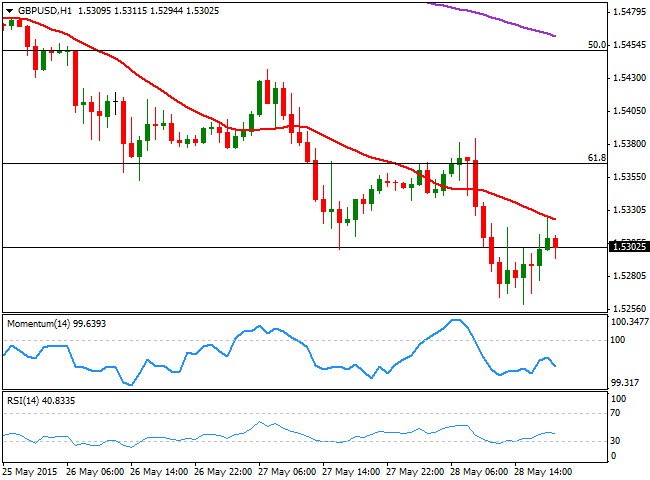
The British Pound was hit by the second reading of the UK GDP for the first quarter of the year that resulted as previously estimated at 0.3% against expectations of an upward revision. The GBP/USD pair fell down to 1.5259, finding buying interest around the strong static support level, but unable to regain firmly the 1.5300 level on the posterior bounce. The technical picture favors the downside, as the price is being capped by a bearish 20 SMA, whilst the Momentum indicator heads lower below 100, and the RSI indicator is also resuming its decline around 40, after correcting oversold levels. In the 4 hours chart, the 20 SMA extended its decline and approaches the 200 EMA, both well below the current level and around the critical Fibonacci resistance at 1.5365, whilst the RSI indicator holds steady at oversold readings and the Momentum indicator lacks directional strength in negative territory, all of which, favors a new leg lower, particularly if the 1.5260 support gives up.
Support levels: 1.5260 1.5220 1.5180
Resistance levels: 1.5320 1.5365 1.5400
USD/JPY Current price: 123.92
View Live Chart for the USD/JPY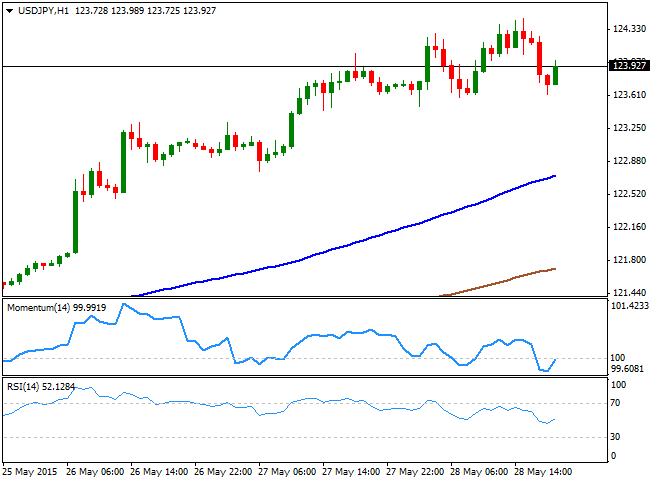
The USD/JPY pair surged to a fresh multi-year high of 124.45, before profit taking send it back below the 124.00 level. Hovering around this last, Japan will release its National and Tokyo inflation figures during the upcoming Asian session, which may trigger additional advances in the pair, as they are expected generally lower, compared to the previous month. From a technical point of view, the 1 hour chart shows that the 100 and the 200 SMAs, maintain their strong bullish slopes below the current level, with the shortest acting as dynamic support around 122.70. In the same chart, the indicators have turned sharply higher, but remain in negative territory, limiting the upside at the time being. In the 4 hours chart, the technical indicators head sharply lower from overbought levels, supporting a downward corrective movement particularly if the price breaks below 123.65 the immediate support.
Support levels: 123.65 123.30 122.70
Resistance levels: 124.40 124.85 125.10
AUD/USD Current price: 0.7652
View Live Chart for the AUD/USD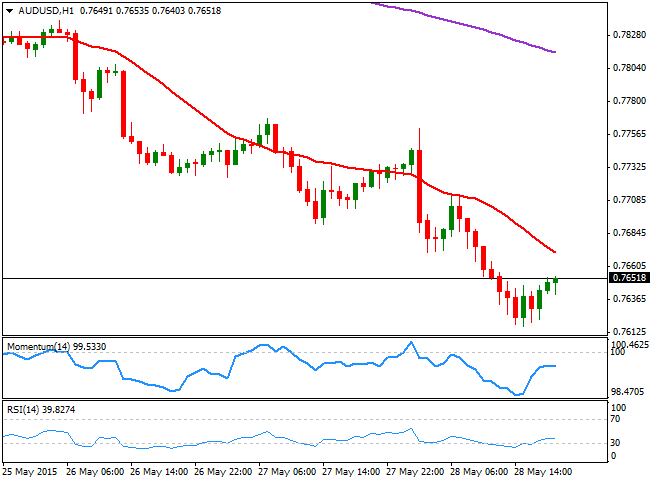
The Australian dollar extended its unstoppable decline down to 0.7618 against the greenback, a fresh 6-week low. The AUD/USD has been on a steady decline daily basis this week, heading back towards the year low set at 0.7532 last April, amid the toss in market's sentiment regarding both Central Banks upcoming moves. Technically, the short term picture maintains the bearish bias, as in the 1 hour chart the price is developing well below a strongly bearish 20 SMA, whilst the technical indicators are turning lower below their mid-lines, after correcting oversold readings. In the 4 hours chart, the 20 SMA stands well above the current level, around 0.7740 now, whilst the technical indicators stand flat in oversold territory, lacking directional strength. The immediate resistance stands around former lows in the 0.7670 level, with a recovery above probably triggering an upward corrective movement up to the mentioned 0.7740 level, where selling interest is expected to resume.
Support levels: 0.7615 0.7580 0.7530
Resistance levels: 0.7670 0.7700 0.7740
Recommended Content
Editors’ Picks
AUD/USD risks a deeper drop in the short term

AUD/USD rapidly left behind Wednesday’s decent advance and resumed its downward trend on the back of the intense buying pressure in the greenback, while mixed results from the domestic labour market report failed to lend support to AUD.
EUR/USD leaves the door open to a decline to 1.0600

A decent comeback in the Greenback lured sellers back into the market, motivating EUR/USD to give away the earlier advance to weekly tops around 1.0690 and shift its attention to a potential revisit of the 1.0600 neighbourhood instead.
Gold is closely monitoring geopolitics

Gold trades in positive territory above $2,380 on Thursday. Although the benchmark 10-year US Treasury bond yield holds steady following upbeat US data, XAU/USD continues to stretch higher on growing fears over a deepening conflict in the Middle East.
Bitcoin price shows strength as IMF attests to spread and intensity of BTC transactions ahead of halving

Bitcoin (BTC) price is borderline strong and weak with the brunt of the weakness being felt by altcoins. Regarding strength, it continues to close above the $60,000 threshold for seven weeks in a row.
Is the Biden administration trying to destroy the Dollar?

Confidence in Western financial markets has already been shaken enough by the 20% devaluation of the dollar over the last few years. But now the European Commission wants to hand Ukraine $300 billion seized from Russia.