EUR/USD Current price: 1.1090
View Live Chart for the EUR/USD

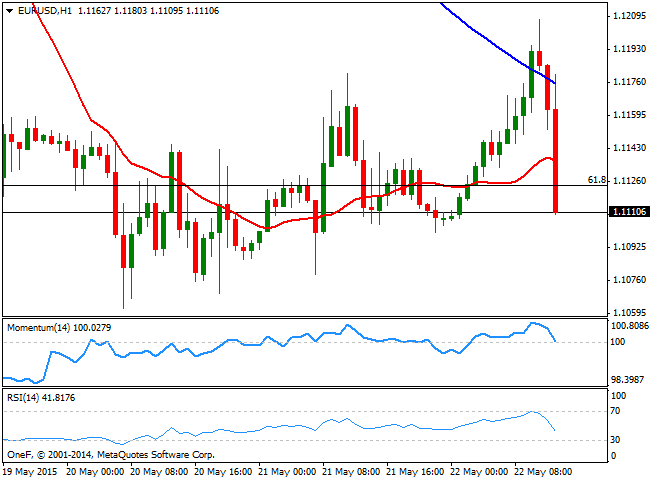
The EUR/USD flirted with the 1.1200 price zone during the European session, amid general dollar weakness, albeit selling interest around the level sent the pair back down towards the 1.1150 price zone. Earlier in the day, the German IFO Survey showed business expectations fell below expected, whist the current situation was seen better than expected, but worse than in the previous month according to May readings. In the meantime, a Central Bankers forum is being held in Portugal and authorities from most of the major economies are scheduled to speak along the day, with investors looking for clues on upcoming economic policy meetings. The US released its inflation figures ahead of the opening, showing that core consumer prices rose in April by the most in 2 years, up to 1.8% yearly basis and 0.3% compared to the previous month. The dollar surged sharply across the board, and the EUR/USD trades near the 1.1100 level, with the 1 hour chart showing that the price is now below its 20 SMA, and the key Fibonacci resistance at 1.1120, whilst the technical indicators have turned sharply lower around their mid-lines. In the 4 hours chart the technical indicators are turning lower around their mid-lines, supporting additional declines should the price extend below 1.1100.
Support levels: 1.1100 1.1050 1.1000
Resistance levels: 1.1160 1.1210 1.1250
GBP/USD Current price: 1.5570
View Live Chart for the GBP/USD
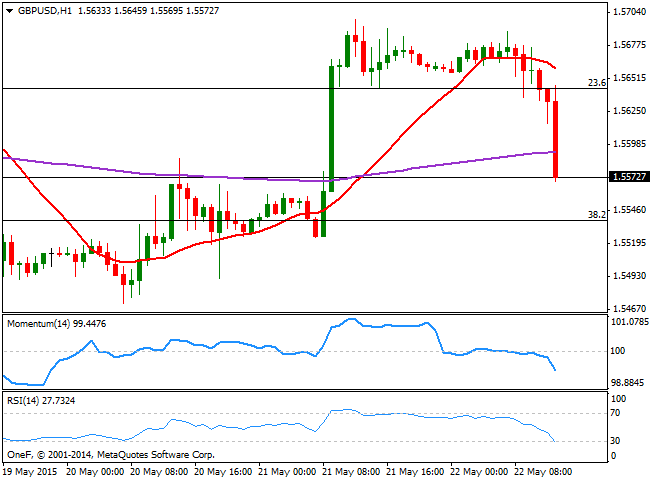
The GBP/USD trader lower in range during the first half of this Friday, reaching a daily low of 1.5615, but for the most consolidating around the 1.5640 level, 23.6% retracement of the bullish run between 1.5088 and 1.5814. US inflation figures release however, pushed the pair lower, now trading below the 1.5600 figure ahead of Wall Street opening. The short term picture supports a downward continuation, with the technical indicators heading sharply lower and the 20 SMA gaining bearish slope above the current price. In the 4 hours chart the price is pressuring a flat 20 SMA in 1.5580, whilst the technical indicators have turned south in positive territory, supporting a test of 1.5535, 38.2% retracement of the same rally. If the price extends below this last, this week low of 1.5445 comes as a probable bearish target for the day.
Support levels: 1.5535 1.5495 1.5445
Resistance levels: 1.5610 1.5640 1.5690
USD/JPY Current price: 121.51
View Live Chart for the USD/JPY
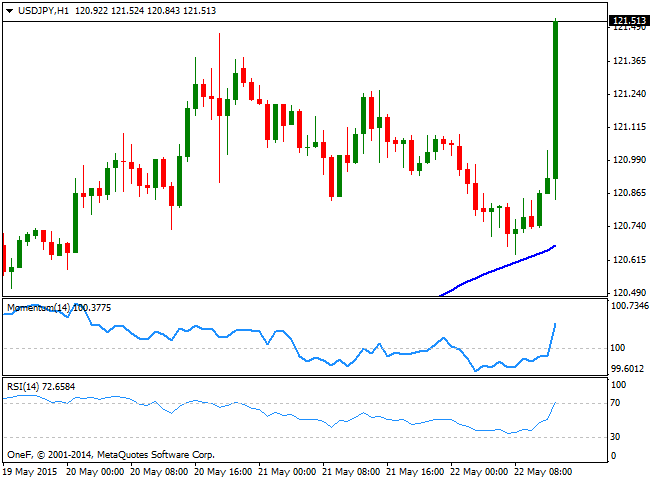
The USD/JPY pair fell down to 120.63 on the back of BOJ monetary policy decision to keep its economic policy unchanged during the Asian session, but surged to fresh monthly highs as dollar gains strength across the board. The 1 hour chart shows that the price is advancing above the 100 SMA that presents a strong bullish slope, while the technical indicators head strongly north above 100. In the 4 hours chat the technical indicators bounced from their mid-lines and regained the upside, supporting a retest of the 122.00 price zone with renewed buying interest above 121.60.
Support levels: 121.15 120.85 120.45
Resistance levels: 121.60 122.10 122.50
Recommended Content
Editors’ Picks
AUD/USD bounces to 0.6450, shrugs off mixed Australian jobs data

AUD/USD is rebounding to test 0.6450 amid renewed US Dollar weakness in the Asian session on Thursday. The pair reverses mixed Australian employment data-led minor losses, as risk sentiment recovers.
USD/JPY drops to test 154.00 on Japan's intervention warnings

USD/JPY extends losses to test 154.00 in Asian trading on Thursday. The pair is undermined by the latest US Dollar pullback, Japan's FX intervention risks and a softer risk tone. Focus shifts to more Fedspeak and US data.
Gold price finds buyers again near $2,355 as USD licks its wounds

Gold price is attempting a tepid bounce in the Asian session, having found fresh demand near $2,355 once again. Gold price capitalizes on a softer risk tone and an extended weakness in the US Treasury bond yields, despite the recent hawkish Fed commentary.
Manta Network price braces for volatility as $44 million worth of MANTA is due to flood markets

Manta Network price was not spared from the broader market crash instigated by a weakness in the Bitcoin market. While analysts call a bottoming out in the BTC price, the Web3 modular ecosystem token could suffer further impact.
Investors hunkering down

Amidst a relentless cautionary deluge of commentary from global financial leaders gathered at the International Monetary Fund and World Bank Spring meetings in Washington, investors appear to be taking a hiatus after witnessing significant market movements in recent weeks.