EUR/USD Current price: 1.0808
View Live Chart for the EUR/USD
Market players choose to dump the greenback for second day in a row, following the release of more tepid US data. With no relevant fundamental releases in the European session, the focus has been in Australian employment up beating data that fueled demand of high yielders during the last Asian session, and weak American figures. In the US, weekly unemployment claims rose to 294K in the week ending April 10, whilst the construction of new houses and building permits for March increased less than expected. Also, the country released its Philadelphia Manufacturing Survey for April, the only positive number of the day at 7.5. But it was not enough to revert dollar bearish course, particularly after FED's Lockhart stated that he sees possible advantages in waiting for stronger data before rising rates, and the price of oil jumped to fresh year highs.
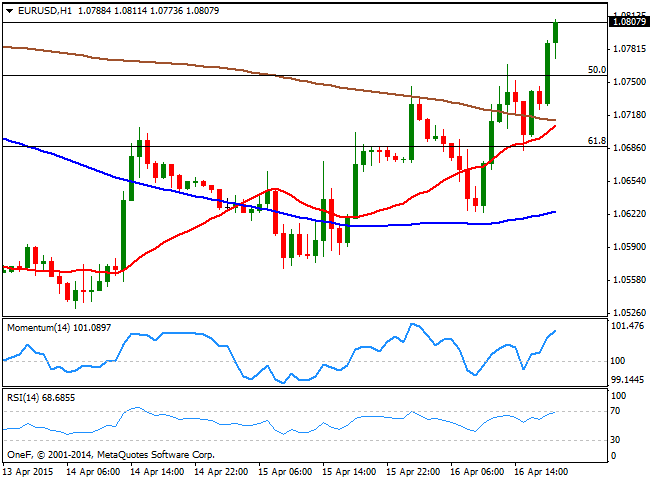
The EUR/USD pair broke higher, reaching daily highs beyond 1.0800 late in the American afternoon and the technical picture favors the upside, as the price recovered above the 50% retracement of the latest daily bullish run at 1.0755. The 1 hour chart shows that the price accelerated above its moving averages, whilst the technical indicators maintain their positive tone well above their mid-lines. In the 4 hours chart the technical indicators present a strong upward momentum well into positive territory, whilst the 20 SMA turned north below the current price. Should the pair break above 1.0825, the 38.2% retracement of the same rally, the upward movement can extend up to 1.0900/50 before the week is over.
Support levels: 1.0755 1.0710 1.0665
Resistance levels: 1.0825 1.0870 1.0910
EUR/JPY Current price: 128.43
View Live Chart for the EUR/JPY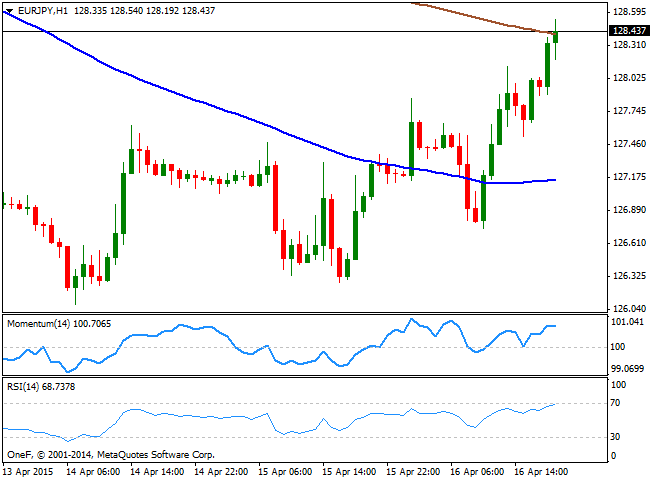
The EUR/JPY cross surged up to 128.54 by the US close, as dollar weakness alongside with EUR's recovery pushed it to a fresh weekly high. Technically, the 1 hour chart shows that the price struggles around its 200 SMA whilst the technical indicators are beginning to look exhausted near overbought levels. In the 4 hours chart however, the technical indicators maintain a strong upward momentum, with the 100 SMA heading lower around 129.00. The pair is positioned to extend its advance as long as 128.10 contains the downside, with a break above 129.00 signaling a probable test of the 130.00 level.
Support levels: 128.10 127.70 127.30
Resistance levels: 128.60 129.10 129.65
GBP/USD Current price: 1.4969
View Live Chart for the GBP/USD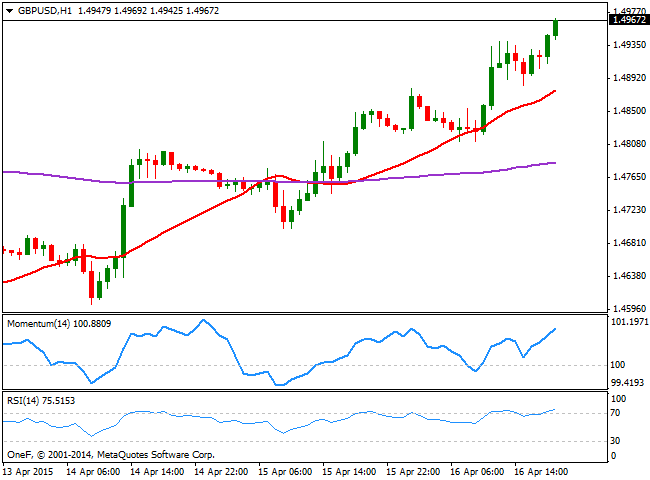
The GBP/USD pair advanced for most of this Thursday, surging towards the 1.4980 level, last week high. The British Pound shrug off market's fears of a hung Parliament, and trades again near the 1.5000 region, the critical figure that has contained the upside since mid March. On Friday, the UK will release its monthly employment figures, expected to present a slight improvement compared to the previous month. A much better-than-expected result there, may see the pair finally breaking above the mentioned level, particularly as the technical stance favors the upside. Short term, the 1 hour chart shows that the technical indicators are heading strongly higher, despite being in overbought territory, whilst the 20 SMA advanced up to 1.4880, providing a strong support in the case of a sudden reversal. In the 4 hours chart the price is accelerating further above its 200 EMA, currently at 1.4910, whilst the technical indicators head strongly up, also in overbought territory.
Support levels: 1.4950 1.4910 1.4880
Resistance levels: 1.5000 1.5040 1.5085
USD/JPY Current price: 118.85
View Live Chart for the USD/JPY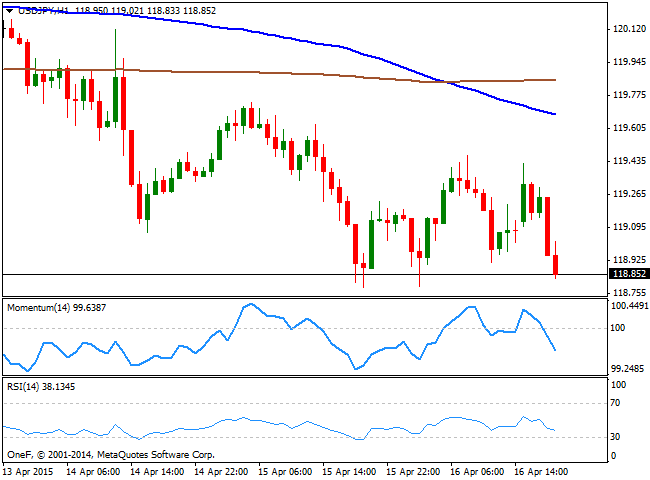
Japanese Yen maintains its strength against the greenback, with the USD/JPY pair pressuring the critical support area at 118.70/80. An early recovery in the pair was quickly reverted by worse-than-expected US economic figures, and the 1 hour chart shows that the 100 SMA crossed below the 200 SMA well above the current level, anticipating further declines. In the same time frame, the Momentum indicator heads strongly south below 100 whilst the RSI indicator also heads lower around 39. In the 4 hours chart the Momentum indicator heads slightly higher below its mid-line, after correcting oversold levels reached earlier in the day, whist the RSI continues to head lower around 38, supporting the shorter term view. A downward acceleration below the mentioned price zone should lead to a continued slide towards the 118.00 region.
Support levels: 118.75 118.35 118.00
Resistance levels: 119.35 119.65 120.00
AUD/USD Current price: 0.7818
View Live Chart for the AUD/USD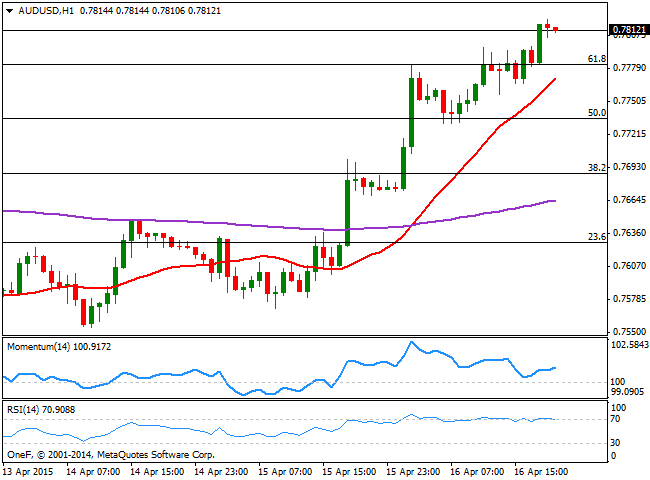
The Australian dollar shined this Thursday, advancing around 150 pips against the greenback to reach a fresh 3-week high around 0.7820. The Aussie found support in a strong jobs report released during the past Asian session that challenges a potential rate hike in the country next May. Technically, the pair has broken above the 61.8% retracement of its latest bearish run between 0.7937 and 0.7532 at 0.7780, now the immediate short term support. The 1 hour chart shows that the 20 SMA advanced alongside with price and stands now around 0.7770, whilst the RSI indicator stands flat in overbought territory, whilst the Momentum indicator heads higher above 100, maintaining the risk towards the upside. In the 4 hours chart the AUD/USD advanced strongly above its 200 EMA, whilst the technical indicators are beginning to look exhausted in overbought territory, but are far from suggesting a bearish corrective movement at the time being. Above 0.7835, the pair should continue advancing, eyeing March 24th daily high of 0.7936.
Support levels: 0.7780 0.7740 0.7700
Resistance levels: 0.7835 0.7880 0.7930
Recommended Content
Editors’ Picks
AUD/USD could extend the recovery to 0.6500 and above

The enhanced risk appetite and the weakening of the Greenback enabled AUD/USD to build on the promising start to the week and trade closer to the key barrier at 0.6500 the figure ahead of key inflation figures in Australia.
EUR/USD now refocuses on the 200-day SMA

EUR/USD extended its positive momentum and rose above the 1.0700 yardstick, driven by the intense PMI-led retracement in the US Dollar as well as a prevailing risk-friendly environment in the FX universe.
Gold struggles around $2,325 despite broad US Dollar’s weakness

Gold reversed its direction and rose to the $2,320 area, erasing a large portion of its daily losses in the process. The benchmark 10-year US Treasury bond yield stays in the red below 4.6% following the weak US PMI data and supports XAU/USD.
Bitcoin price makes run for previous cycle highs as Morgan Stanley pushes BTC ETF exposure

Bitcoin (BTC) price strength continues to grow, three days after the fourth halving. Optimism continues to abound in the market as Bitcoiners envision a reclamation of previous cycle highs.
US versus the Eurozone: Inflation divergence causes monetary desynchronization

Historically there is a very close correlation between changes in US Treasury yields and German Bund yields. This is relevant at the current juncture, considering that the recent hawkish twist in the tone of the Federal Reserve might continue to push US long-term interest rates higher and put upward pressure on bond yields in the Eurozone.