EUR/USD Current price: 1.0875
View Live Chart for the EUR/USD
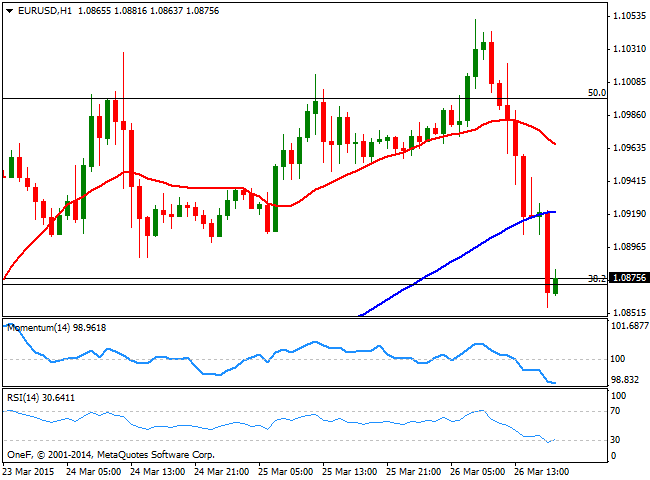
The greenback retreated sharply this Thursday, only to jump higher in the American afternoon. The day started with a risk-off sentiment and commodities soaring, on news Saudi Arabia launched an air strike on Yemen arising tension in the Middle East that led to a sell-off in equities markets, and drove the EUR/USD to a fresh 3-week high of 1.1051. The fall in EUR for these last months, alongside with ECB's bond buying, was the reason European share markets rose to record highs, as a cheaper currency helped boost export relates equities, and the inverted correlation prevailed until the American session began. In the US, better-than-expected weekly unemployment claims, down to 282K last week helped the greenback claw back higher, whilst quietus came after the release of US Markit Services PMI figures, posting the sharpest rise in the sector for six months in March.
The EUR/USD pair nose-dived down to 1.0855, finding finally buying interest around the 38.2% retracement of these last two months slide. The 1 hour chart shows that the price extended below its 20 and 100 SMAs, whilst the technical indicators remain near oversold territory, albeit losing their bearish strength. In the 4 hours chart the price accelerated below its 20 SMA, currently around 1.0950, whilst the technical indicators maintain their strong bearish slopes below their mid-lines, anticipating additional declines particularly if the price falls beyond the mentioned low.
Support levels: 1.0855 1.0820 1.0780
Resistance levels: 1.0900 1.0950 1.1000
EUR/JPY Current price: 129.65
View Live Chart for the EUR/JPY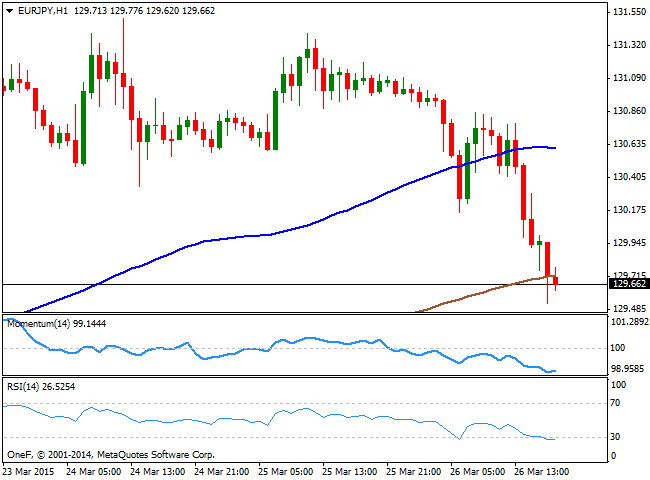
The Japanese yen strengthened against most of its rivals, supported by safe-haven demand and falling stocks. The EUR/JPY pair fell down to 129.52, and the 1 hour chart shows that the price broke below its 100 and 200 SMA, with the latest offering an immediate short term resistance at 129.70, whilst the technical indicators remain well into negative territory and with the RSI still heading lower, despite being at 26. In the 4 hours chart the price is back below a bearish 100 SMA whilst the technical indicators head south below their mid-lines, supporting some further declines for this Friday.
Support levels: 129.30 128.80 128.40
Resistance levels: 129.90 130.35 130.80
GBP/USD Current price: 1.4843
View Live Chart for the GBP/USD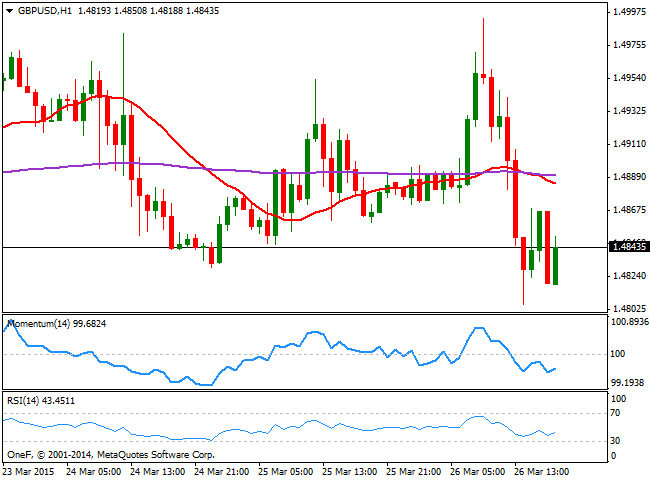
The British Pound enjoyed some temporal demand during the European session, following the release of the UK Retail Sales that grew sharply in March, up 5.7% compared to a year before. The GBP/USD pair rose to a daily high of 1.4993, but selling interest halted the advance once again and the pair edged down to 1.4806 on dollar's later recovery. The technical picture in the short term favors the downside, as the price consolidates around former weekly low, whilst the 20 SMA gains a mild bearish slope above the current level, and the technical indicators stand below their mid-lines, albeit lacking directional strength. In the 4 hours chart the price stands below its 20 SMA whilst the Momentum indicator consolidates below the 100 level and the RSI indicator heads lower around 44, all of which supports the shorter term bias. A break below 1.4805 should lead to a quick decline towards the 1.4770 level a strong static support, while if this last gives up, the fall can extend down to 1.4730.
Support levels: 1.4805 1.4770 1.4730
Resistance levels: 14880 1.4920 1.4950
USD/JPY Current price: 119.25
View Live Chart for the USD/JPY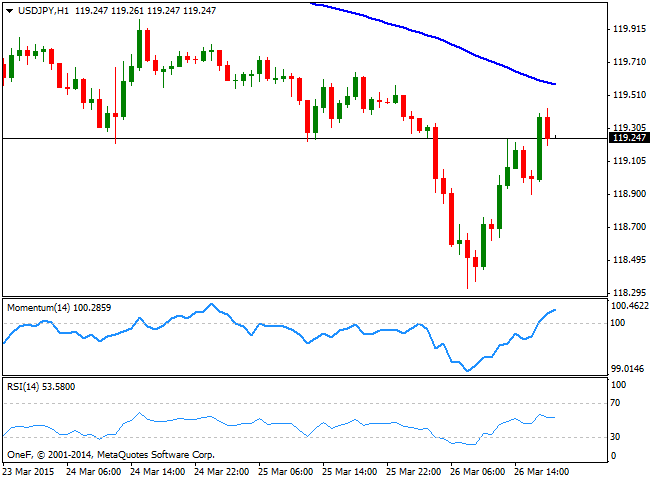
The USD/JPY pair fell down to a fresh 5-week low of 118.32, before finally stalling having recovered around 100 pips on the back of USD strength and rising US yields, with the 10Y one back at 2.00%. During the upcoming Asian session, Japan will release data related to inflation, employment and household spending, which may imprint some life to yen crosses particularly if the figures are soft. In the meantime, the 1 hour chart shows that the intraday recovery extended up to 119.42, well below a strongly bearish 100 SMA, currently around 119.65. In the same chart, the Momentum indicator remains above 100 although partially losses its bullish strength while the RSI stands around 53. In the 4 hours chart the technical indicators bounced strongly from oversold territory and maintain their bullish slopes, albeit are still below their mid-lines. The price needs to recover above the 119.65 resistance level to be able to continue advancing, with the next resistance at the psychological 120.00 figure.
Support levels: 119.15 118.70 118.30
Resistance levels: 119.65 120.00 120.40
AUD/USD Current price: 0.7814
View Live Chart for the AUD/USD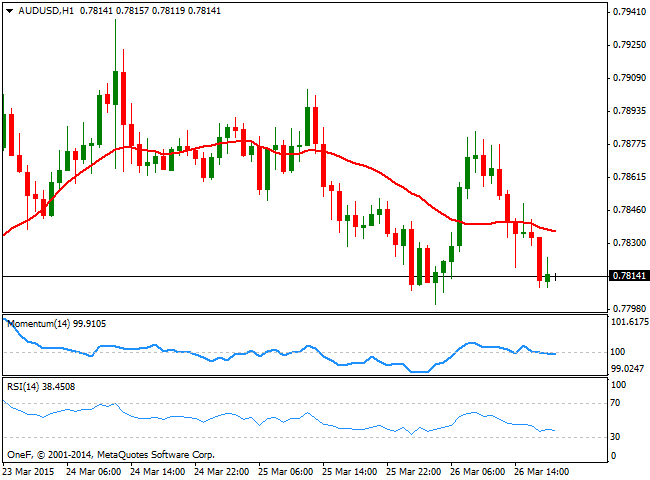
The AUD/USD pair posted a lower high daily basis before resuming its decline, posting its third negative day in a row. The sentiment towards the Aussie is negative, considering investors are still pricing in a rate cut as soon as next month in Australia. Trading near the daily low established during the past Asian session at 0.7800, the 1 hour chart presents a mild bearish tone, as the price develops below its 20 SMA whilst the Momentum indicator presents a tepid bearish slope below 100 and the RSI anticipates additional declines, heading lower around 37. In the 4 hours chart the technical picture is strongly bearish, as the price extends below its 20 SMA while the technical indicators maintain a strong bearish bias below their mid-lines. In this last time frame, the 200 EMA stands around 0.7770, providing a strong dynamic support, which means a break below it should favor further dollar gains, eyeing an approach to the 0.7720/30 price zone.
Support levels: 0.7800 0.7770 0.7725
Resistance levels: 0.7840 0.7880 0.7910
Recommended Content
Editors’ Picks
EUR/USD clings to daily gains above 1.0650

EUR/USD gained traction and turned positive on the day above 1.0650. The improvement seen in risk mood following the earlier flight to safety weighs on the US Dollar ahead of the weekend and helps the pair push higher.
GBP/USD recovers toward 1.2450 after UK Retail Sales data

GBP/USD reversed its direction and advanced to the 1.2450 area after touching a fresh multi-month low below 1.2400 in the Asian session. The positive shift seen in risk mood on easing fears over a deepening Iran-Israel conflict supports the pair.
Gold holds steady at around $2,380 following earlier spike

Gold stabilized near $2,380 after spiking above $2,400 with the immediate reaction to reports of Israel striking Iran. Meanwhile, the pullback seen in the US Treasury bond yields helps XAU/USD hold its ground.
Bitcoin Weekly Forecast: BTC post-halving rally could be partially priced in Premium

Bitcoin price shows no signs of directional bias while it holds above $60,000. The fourth BTC halving is partially priced in, according to Deutsche Bank’s research.
Week ahead – US GDP and BoJ decision on top of next week’s agenda

US GDP, core PCE and PMIs the next tests for the Dollar. Investors await BoJ for guidance about next rate hike. EU and UK PMIs, as well as Australian CPIs also on tap.