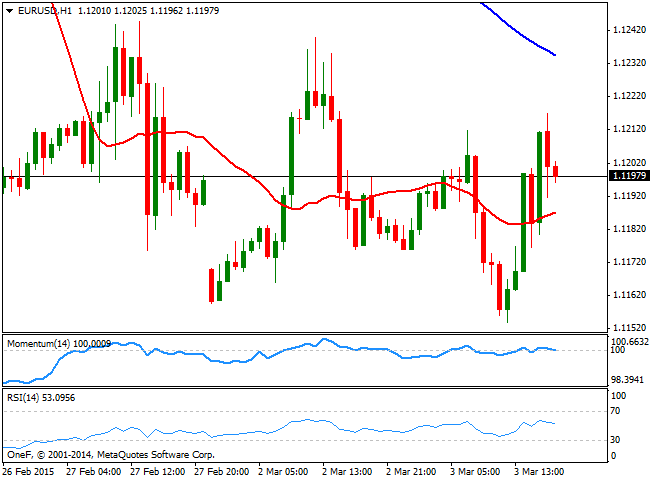
EUR/USD Current price: 1.1187
View Live Chart for the EUR/USD
From a technical point of view, the intraday charts offer a neutral stance, as the price moved back and forth around a flat 20 SMA, whilst the Momentum and the RSI indicators present a mild bearish slope around their mid-lines. The 100 SMA in the mentioned time frame stands around 1.1240, whilst selling interest also awaits in the area, making it difficult for the pair to advance beyond that unless a huge catalyst triggers EUR demand. In the 4 hours chart the price is struggling around a bearish 20 SMA whilst the technical indicators stand directionless below their mid-lines, giving no much clues on what's next. Nevertheless, a break below 1.1140 should trigger some stops and favor a retest of the 1.1097 year low posted last January.
Support levels: 1.1140 1.1095 1.1050
Resistance levels: 1.1210 1.1250 1.1285
EUR/JPY Current price: 133.83
View Live Chart for the EUR/JPY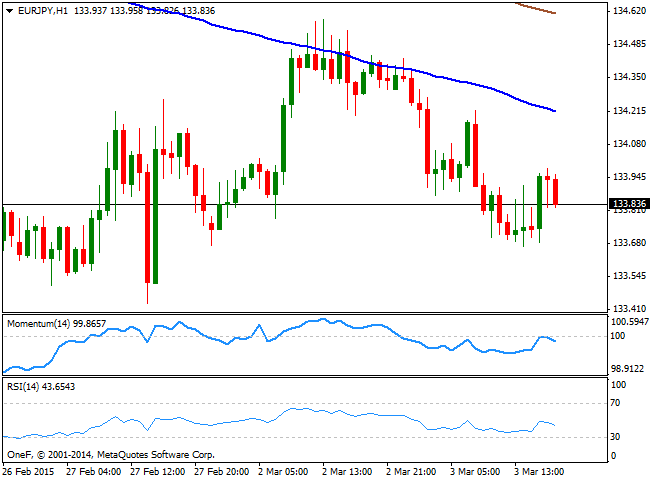
The Japanese Yen surged against most of its rivals during the previous Asian session, supported by comments from Etsuro Honda, an economic adviser of Japanese Prime Minister Shinzo Abe, saying the BOC should refrain from adding further stimulus at least for some time, in an interview given earlier today to the Wall Street Journal. The EUR/JPY fell as low as 133.66 during the American afternoon, bouncing as stocks recovered from their lows, although capped by 134.00. The 1 hour chart shows that the price continues to trade below a bearish 100 SMA currently around 134.20, whist the technical indicators turned lower after testing their mid-lines. In the 4 hours chart the technical indicators maintain a neutral stance, hovering around their mid-lines, whilst the price develops below its moving averages, pointing for some additional declines, particularly if the pair breaks below 133.45, this week low.
Support levels: 133.45 133.10 132.70
Resistance levels: 134.20 134.75 135.20
GBP/USD Current price: 1.5378
View Live Chart for the GBP/USD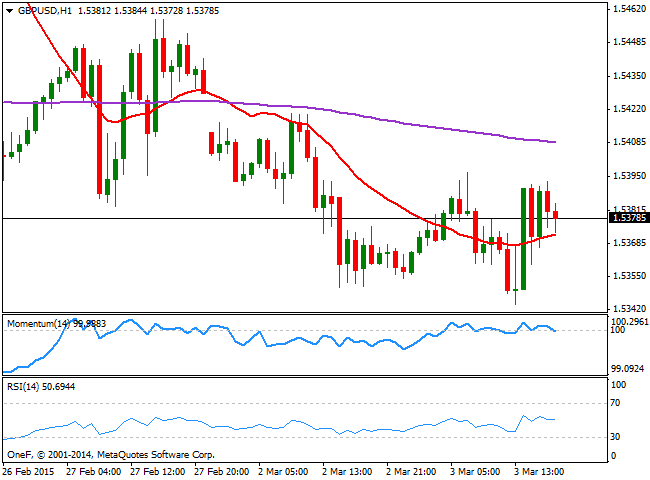
The GBP/USD pair traded within a constrained range this Tuesday, with the Pound receiving some attention during the European session, following the release of the UK Construction PMI, up to 60.1 in February. The pair surged up to 1.5393 on the day, but failed to post a higher high, although reach a fresh low at 1.5349, keeping the risk towards the downside in the long run. Short term and according to the 1 hour chart, the technical indicators are heading lower right below their mid-lines, whilst the price pressures a flat 20 SMA a few pips below the current level, supporting another leg south. In the 4 hours chart the overall bias is bearish, with the price developing below its 20 SMA, the Momentum indicator heading south below 100 and the RSI indicator hovering around 40. However, the pair has found intraday buyers around the 200 EMA in this last time frame that continues to act as immediate and strong support around 1.5335. Should the pair accelerate below it, the risk towards the downside will increase, eyeing 1.5250 as a possible bearish target for the upcoming 24 hours.
Support levels: 1.5335 1.5290 1.5250
Resistance levels: 1.5400 1.5450 1.5490
USD/JPY Current price: 119.58
View Live Chart for the USD/JPY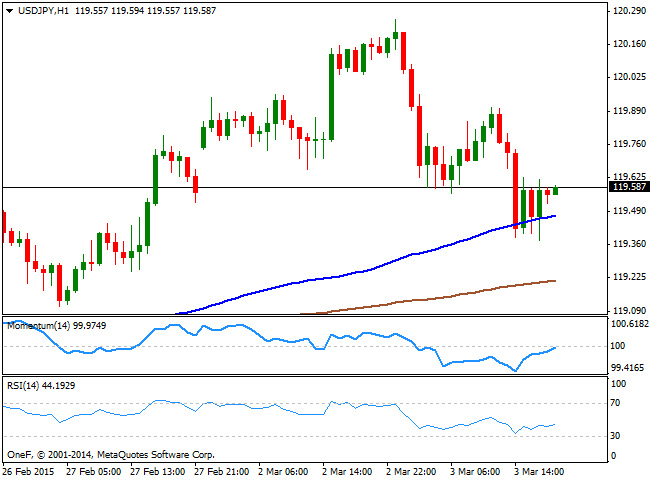
The USD/JPY pair erased all of its weekly gains, back to square one right above the 119.40 level by the end of the US session. The 1 hour chart for the pair shows that the price found support around a bullish 100 SMA currently around 119.50, whilst the 200 SMA stands around 119.20, acting as the next dynamic support in the case the first gives up. The technical indicators in the mentioned time frame head higher right below their mid-lines, which should keep the downside limited in the short term, although as long as the price holds below the 119.90/120.00 area, there's no scope for more sustainable gains. In the 4 hours chart, the technical indicators have fallen sharply towards their mid-lines, and stand ready to cross them lower, suggesting that a price acceleration below the 119.50 support may lead to a stronger decline down to the 118.80 price zone.
Support levels: 119.50 119.10 118.80
Resistance levels: 119.95 120.45 120.90
AUD/USD Current price: 0.7830
View Live Chart for the AUD/USD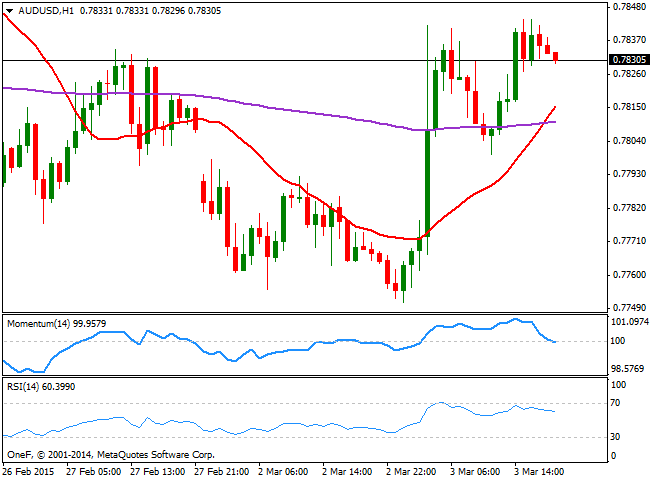
The Australian dollar got a nice boost from the RBA during the past Asian session, as the Central Bank, unexpectedly, decided to keep its cash rate unchanged at 2.25%, although authorities remarked that policy easing may still be appropriate in the near future. The AUD/USD pair surged up to 0.7842 following the news, finding afterwards buying interest on an approach to the 0.7800 figure. The pair retested the highs in the American afternoon, but was unable to rally beyond the strong static resistance level. From a technical point of view, the 1 hour chart shows that the price holds above a strongly bullish 20 SMA currently around 0.7805, whilst the technical indicators maintain their bearish slopes, particularly with the Momentum indicator pressuring the 100 level, which should at least keep the upside limited. In the 4 hours chart the technical readings maintain a neutral stance, with the indicators flat around their mid-lines, and the price barely above a bearish 20 SMA.
Support levels: 0.7800 0.7755 0.7720
Resistance levels: 0.7840 0.7890 0.7925
Recommended Content
Editors’ Picks
AUD/USD remains under pressure above 0.6400

AUD/USD managed to regain some composure and rebounded markedly from Tuesday’s YTD lows in the sub-0.6400 region ahead of the release of the Australian labour market report on Thursday.
EUR/USD holds above 1.0650 amid renewed selling pressure in US Dollar

The EUR/USD pair edges higher to 1.0672 on Thursday during the early Asian session. The recovery of that major pair is bolstered by renewed selling pressure in the US Dollar and a risk-friendly environment.
Gold retreats as lower US yields offset the impact of hawkish Powell speech

Gold prices retreated from close to weekly highs during the North American session on Wednesday amid an improvement in risk appetite. The bullish impulse arrived despite hawkish commentary by US Federal Reserve officials.
Bitcoin price uptrend to continue post-halving, Bernstein report says as traders remain in disarray

Bitcoin price is dropping amid elevated risk levels in the market. It comes as traders count hours to the much-anticipated halving event. Amid the market lull, experts say we may not see a rally until after the halving.
Australia unemployment rate expected to rise back to 3.9% in March as February boost fades

Australia will publish its monthly employment report first thing Thursday. The Australian Bureau of Statistics is expected to announce the country added measly 7.2K new positions in March after the outstanding 116.5K jobs created in February.
