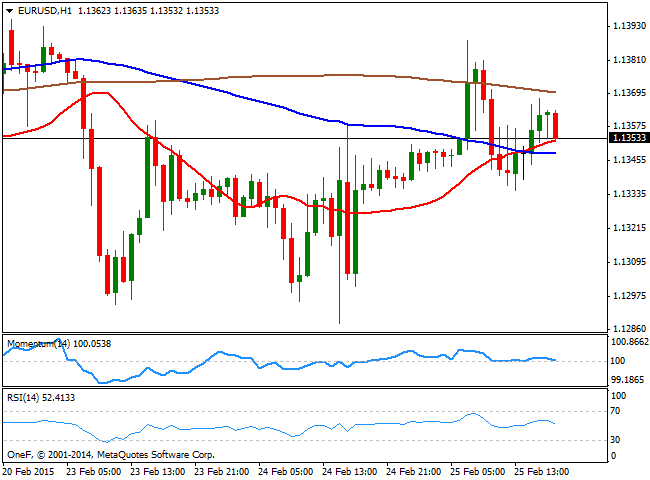
EUR/USD Current price: 1.1196
View Live Chart for the EUR/USD
The new month starts with the EUR weakening further against its rivals, as the market's attention shifted once again towards the upcoming launch of quantitative easing in Europe, expected to begin as soon as March 9. But the ECB won't be the only Central Bank to dominate the headlines, as among the major economies, there will be economic policy meetings also in Australia, the UK and Canada, whilst the Chinese one cut its benchmark interest rate by surprise for the second time in three months last Saturday. The surprise came as a slowing economy leads to disinflation in the second world economy. By opposition, the US continues to transit the path of growth, with above-expected readings for inflation, and Durable Goods Orders according to the latest data, favoring further dollar broad strength.
Aiming to start the week with a gap lower, the EUR/USD pair trades around 1.1180 early interbank trading, and the technical picture reaffirms the dominant bearish long term trend, after the pair broke below 1.1250, the support level that contained the downside for all of the past February. The 4 hours chart shows that the price develops below a strongly bearish 20 SMA whilst the Momentum indicator heads lower below 100 and the RSI indicators hovers around oversold territory. The immediate short term resistance comes at 1.1170, with scope to test the year low of 1.1097 should the level give up. To the upside, the mentioned 1.1250 price zone will probably attract selling interest if reached with a break above it is seen as unlikely at the time being.
Support levels: 1.1170 1.1130 1.1100
Resistance levels: 1.1250 1.1285 1.1320
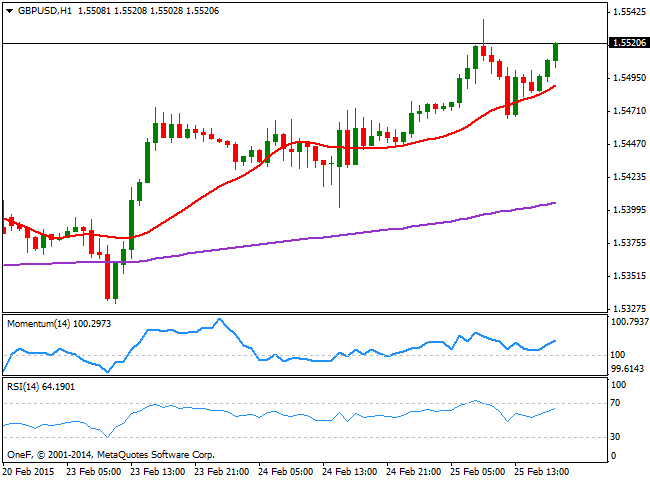
GBP/USD Current price: 1.5428
View Live Chart for the GBP/USD
The British Pound continues to be the only currency able to battle against the dollar strength, as the GBP/USD holds around the 1.5430 as a new week starts. The BOE is expected to have its monthly policy meeting this week, although there are no expectations of a change in rates or the Assets Purchase Program. Last month, all of the 9 MPC voting members voted to keep rates on hold, so if there is going to be a surprise there, it may come from a change towards a rate hike from a minority, albeit chances are quite limited. In the meantime, the 4 hours chart for the pair shows that a short term ascendant trend line coming from February 12 daily low offers an immediate short term support around 1.5405 for this Monday, while the price stands below a flat 20 SMA, currently at 1.5480, and the technical indicators head lower below their mid-lines, all of which suggests the pair may head south in the short term, with a break below the mentioned trend line exposing the 1.5330 price zone.
Support levels: 1.5405 1.5380 1.5330
Resistance levels: 1.5450 1.5490 1.5535
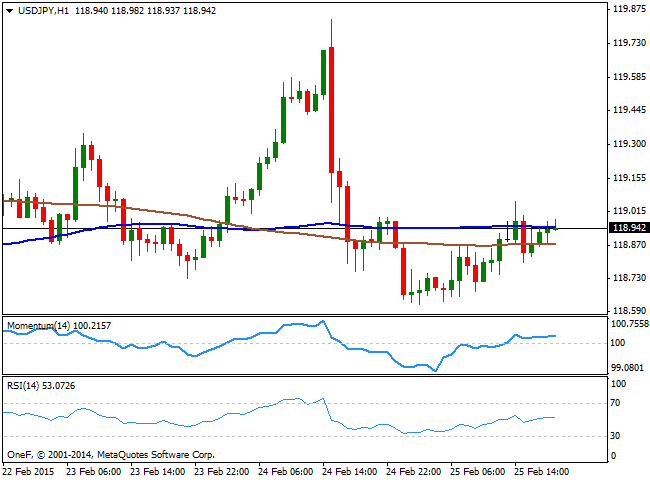
USD/JPY Current price: 119.54
View Live Chart for the USD/JPY
The USD/JPY pair continues to push higher towards the 120.00 level, as better-than expected US data has finally helped the pair firm up above the 119.00 level late last week. The early interbank quotation shows a limited 30 pips to the upside, supporting the constructive outlook of the pair. Technically, the 4 hours chart shows that the price holds well above its 100 SMA, which moved further above the 200 SMA. The momentum indicator in the mentioned time frame holds above 100, having partially lost its strength amid late Friday consolidation, whilst the RSI indicator retraced from overbought territory, but remains well above the 50 level. A steady advance above 119.85 should lead to a test of the next upward resistance level around 120.47, February monthly high, whist an extension above this last exposes the 121.50 price zone, this year high. Buyers should surge on approaches to 119.40 to keep the upside favored, with a break below this last risking a downward correction down to the 118.80 price zone.
Support levels: 119.40 118.80 118.25
Resistance levels: 119.85 120.45 120.90
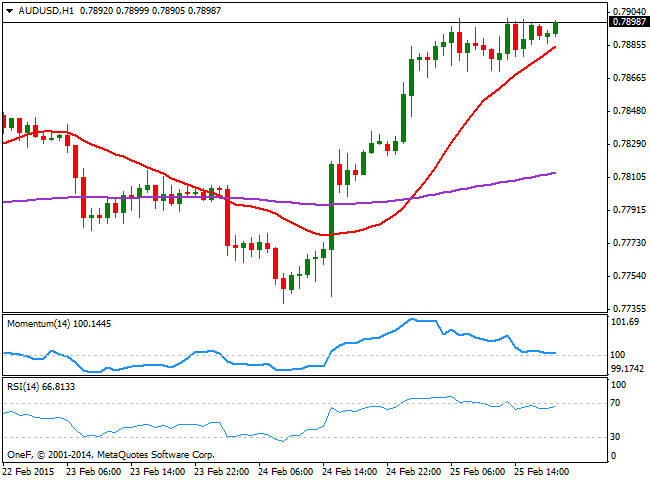
AUD/USD Current price: 0.7807
View Live Chart for the AUD/USD
The AUD/USD pair trades steady around the 0.7800, mute with mixed news from China, as following the surprise rate cut, the country's Services PMI reading beat expectations: Non manufacturing PMI printed 53.9 in February against 53.7 expected, while the NBS Manufacturing reading reached 49.7 against 49.9 expected. The Aussie may be on hold as there are some market talks about a possible rate cut coming next Tuesday with the RBA meeting. The Central Bank already cut rates last month and historically, there are no precedents of two rate cuts in a row, which dilutes the chances, albeit investors seem to have turned into cautious mode. Technically, the 4 hours chart shows that the price stands below a mild bullish 20 SMA, while the price failed to overcome its 200 SMA last week, currently around 0.7890. The indicators in the mentioned time frame head lower below their mid-lines, keeping the risk towards the downside. The key support stands at 0.7720 with a break below it probably seeing the pair resuming the long term bearish trend.
Support levels: 0.7770 0.7720 0.7680
Resistance levels: 0.7840 0.7890 0.7935
Recommended Content
Editors’ Picks
AUD/USD holds hot Australian CPI-led gains above 0.6500

AUD/USD consolidates hot Australian CPI data-led strong gains above 0.6500 in early Europe on Wednesday. The Australian CPI rose 1% in QoQ in Q1 against the 0.8% forecast, providing extra legs to the Australian Dollar upside.
USD/JPY sticks to 34-year high near 154.90 as intervention risks loom

USD/JPY is sitting at a multi-decade high of 154.88 reached on Tuesday. Traders refrain from placing fresh bets on the pair as Japan's FX intervention risks loom. Broad US Dollar weakness also caps the upside in the major. US Durable Goods data are next on tap.
Gold price cautious despite weaker US Dollar and falling US yields

Gold retreats modestly after failing to sustain gains despite fall in US Treasury yields, weaker US Dollar. XAU/USD struggles to capitalize following release of weaker-than-expected S&P Global PMIs, fueling speculation about potential Fed rate cuts.
Crypto community reacts as BRICS considers launching stablecoin for international trade settlement

BRICS is intensifying efforts to reduce its reliance on the US dollar after plans for its stablecoin effort surfaced online on Tuesday. Most people expect the stablecoin to be backed by gold, considering BRICS nations have been accumulating large holdings of the commodity.
US versus the Eurozone: Inflation divergence causes monetary desynchronization

Historically there is a very close correlation between changes in US Treasury yields and German Bund yields. This is relevant at the current juncture, considering that the recent hawkish twist in the tone of the Fed might continue to push US long-term interest rates higher and put upward pressure on bond yields in the Eurozone.
