EUR/USD Current price: 1.1567
View Live Chart for the EUR/USD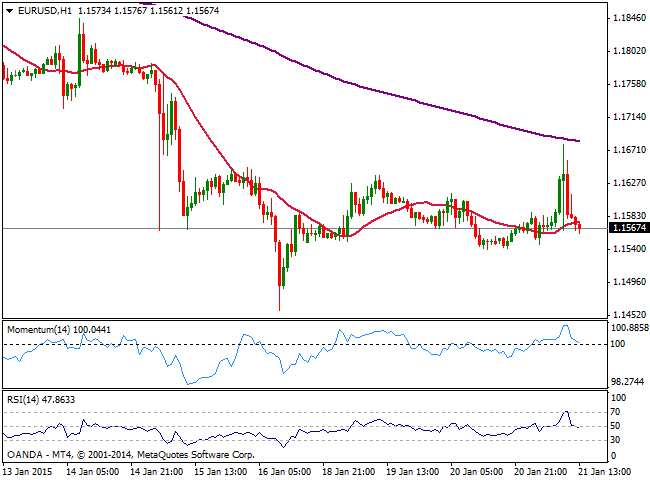
Investors got a couple more Central Bank’s bombshells this Wednesday, as if last week SNB movement was not enough. A quiet market went wild after news hit the wires that two euro-area central-bank officials said the ECB Executive Board has proposed quantitative easing of 50 billion Euros a month until the end of 2016. Earlier on the day BOE Minutes weighted on Pound as all 9 voting members decided to keep rates on hold, diluting chances of a rate hike in the UK during this 2015. And right after ECB news, the Central Bank of Canada cut its rate by surprise down to 0.75%: USD/CAD jumped over 300 pips dragging AUD and Gold lower, this last, losing roughly $20 in a couple hours.
The EUR/USD pair jumped briefly to a 5-day high of 1.1679, before sinking again below 1.1600, to close the day flat. In fact, the daily chart shows a third doji in a row with long upper shadows, reflecting both, the absence of a clear trend and the interest of selling higher. The bearish long term trend remains firm in place, with latest staticity seen as a consolidative stage in the middle of the way, and of course extreme cautious mode among investors ahead of ECB’s announcement in the next European session. The announcement, should it meet today’s anticipated 1,1T Euros, should keep the common currency in the selling side in the midterm, regardless immediate reaction can drive the pair as high as 1.1720 tomorrow. A break below 1.1458 this year low on the other hand, exposes the pair to a steady decline towards 1.1370, next strong midterm support.
Support levels: 1.1545 1.1510 1.1460
Resistance levels: 1.1600 1.1640 1.1680
EUR/JPY Current price: 136.40
View Live Chart for the EUR/JPY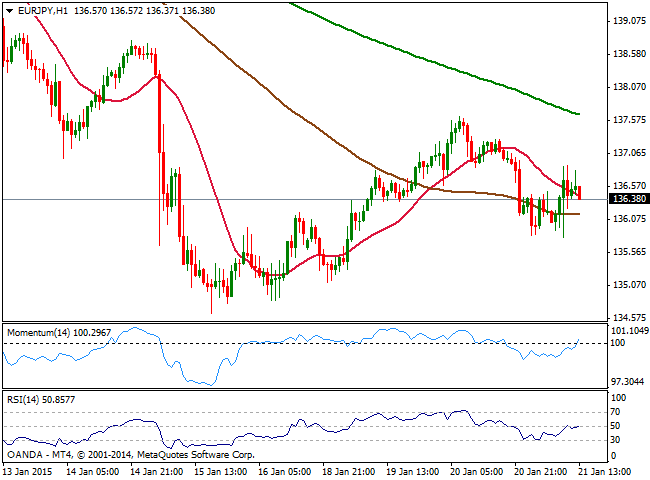
The Japanese yen resumed its advance across the board, following BOJ’s monthly economic meeting where the Central Bank its current policy unchanged, as according to Governor Kuroda, the economy continues to recover and inflation will likely reach the 2% target by the end of the year. The EUR/JPY cross fell as low as 135.79 intraday, in the green however amid stocks’ bounce. The short term picture shows that the price stands above its 100 SMA in the hourly chart, albeit indicators are losing the upward potential around their midlines, giving no clues on directional strength at the time being. In the 4 hours chart however, technical readings present a mild positive tone as per momentum aiming higher above 100 and RSI around 47. The weekly high stands at 137.63, so it will take a price acceleration through it to confirm a recovery that can extend up to the 138.80 price zone.
Support levels: 136.40 135.85 135.30
Resistance levels: 137.00 137.60 138.00
GBP/USD Current price: 1.5114
View Live Chart for the GBP/USD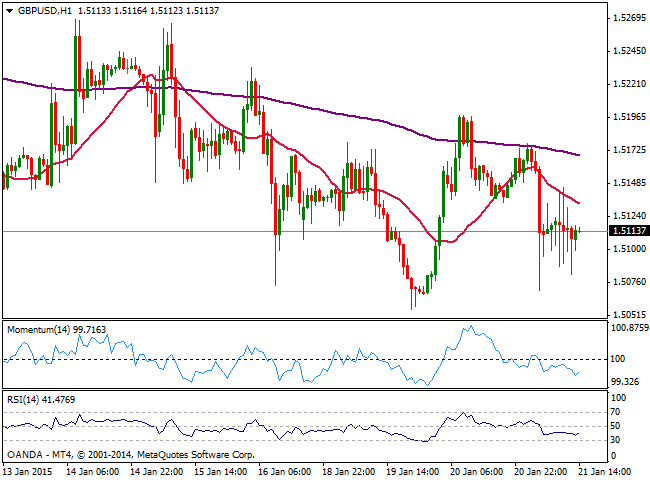
The Cable fell as low as 1.5070 early Europe, on the back of BOE’s Minutes, as policy makers Martin Weale and Ian McCafferty dropped their call for an interest-rate increase this month. The MPC vote unanimously to keep rates steady, as inflation risk turned to the downside, with chances of falling sub zero during this first quarter of the year. Equality to stating the UK won’t raise rates this year, the pair remained under pressure for the rest of the day. UK monthly employment figures passed without notice, showing a fair increase in employment albeit wages remained subdued.
Technically, the pair remained within latest range, still unable to set a clear trend. Nevertheless, the 1 hour chart presents a bearish bias, with the price capped by its 20 SMA now around 1.5135, and indicators heading south below their midlines. In the 4 hours chart the technical picture also favors the downside although short term buyers continue to surge around 1.5070. A break below the level exposes the monthly low of 1.5033 while if this last gives up, 1.4980 comes next.
Support levels: 1.5110 1.5070 1.5030
Resistance levels: 1.5135 1.5190 1.5225
USD/JPY Current price: 117.87
View Live Chart for the USD/JPY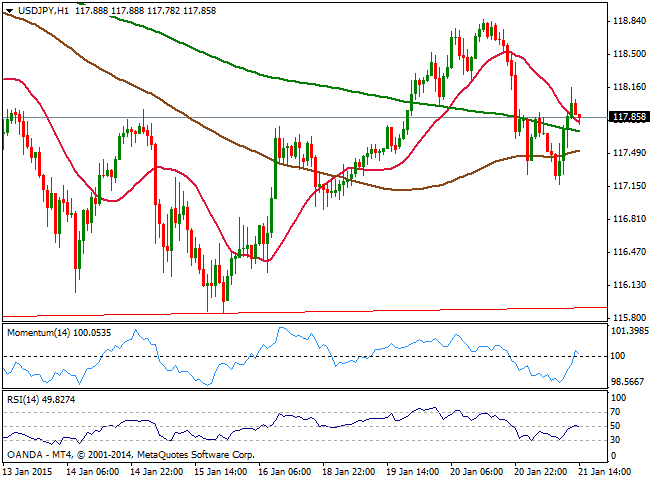
The USD/JPY pair fell to a daily low of 117.15 before recovering back to past Asian session opening where it stands by the end of the US session, maintaining an overall week tone ever since toping at 121.83 early December. Short term the 1 hour chart shows that the price advanced above its moving averages that converge in a tight range 30 pips range right below the current level, which reflects latest lack of definitions in the pair. Indicators in the same time frame turned lower after reaching their midlines, supporting some further declines if the pair remains unable to regain the 118.00 level. In the 4 hours chart the price hovers around its 20 SMA, whilst indicators turned flat around their midlines. More relevant, a couple of daily descendant trend lines between descendant daily highs should keep the upside limited, with the immediate around 118.60 for this Thursday.
Support levels: 117.45 117.00 116.60
Resistance levels: 118.20 118.60 119.00
AUD/USD Current price: 0.8095
View Live Chart of the AUD/USD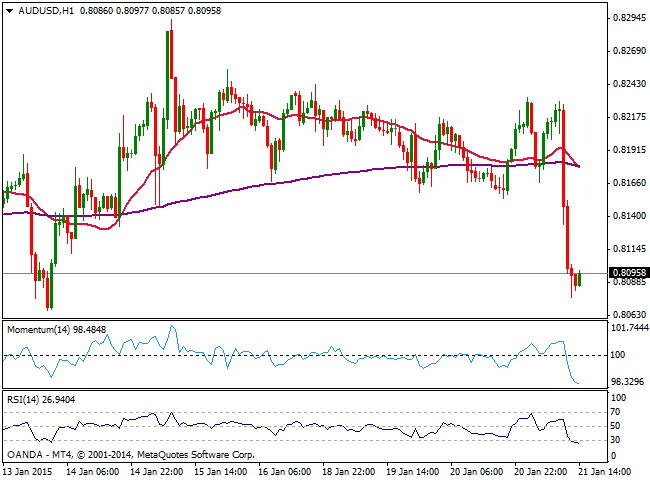
The Australian dollar finally capitulated against the greenback, with the pair losing over 100 pips in a couple of hours, edging below 0.8100 by the end of the day. The slump in the AUD/USD pair came along with gold sharp reversal following speculation the ECB will announce a 1,1T Euros stimulus. The 1 hour chart shows indicators losing the bearish momentum but steady in oversold territory, as the price consolidates near its low of 0.8077, not suggesting yet an upward correction. In the 4 hours chart technical readings present a strong bearish momentum supporting further declines particularly if 0.8070 static support gives up, exposing the pair to a test of 0.7960 a major long term static Fibonacci support.
Support levels: 0.8070 0.8035 0.7990
Resistance levels: 0.8115 0.8150 0.8190
Recommended Content
Editors’ Picks
EUR/USD climbs to 10-day highs above 1.0700

EUR/USD gained traction and rose to its highest level in over a week above 1.0700 in the American session on Tuesday. The renewed US Dollar weakness following the disappointing PMI data helps the pair stretch higher.
GBP/USD extends recovery beyond 1.2400 on broad USD weakness

GBP/USD gathered bullish momentum and extended its daily rebound toward 1.2450 in the second half of the day. The US Dollar came under heavy selling pressure after weaker-than-forecast PMI data and fueled the pair's rally.
Gold rebounds to $2,320 as US yields turn south

Gold reversed its direction and rose to the $2,320 area, erasing a large portion of its daily losses in the process. The benchmark 10-year US Treasury bond yield stays in the red below 4.6% following the weak US PMI data and supports XAU/USD.
Here’s why Ondo price hit new ATH amid bearish market outlook Premium

Ondo price shows no signs of slowing down after setting up an all-time high (ATH) at $1.05 on March 31. This development is likely to be followed by a correction and ATH but not necessarily in that order.
Germany’s economic come back

Germany is the sick man of Europe no more. Thanks to its service sector, it now appears that it will exit recession, and the economic future could be bright. The PMI data for April surprised on the upside for Germany, led by the service sector.