EUR/USD Current price: 1.2261
View Live Chart for the EUR/USD
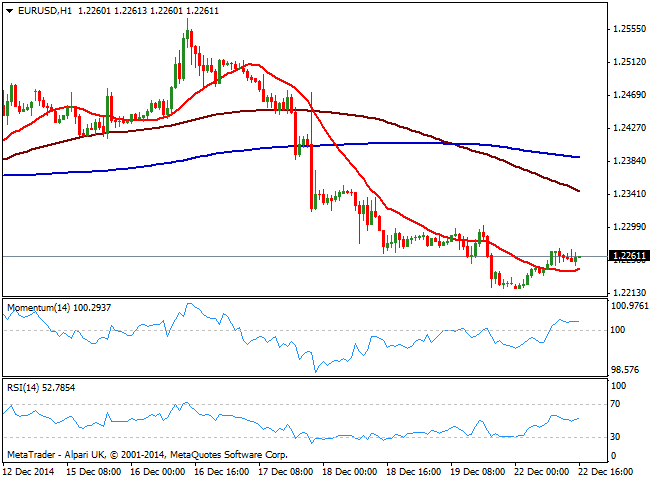
The EUR/USD pair trades uneventfully near its daily high of 1.2272 in an extremely quiet pre-holiday’s Monday. Despite markets are opened all through the world, investors seem to have already closed their trading desks. The slightly positive tone the pair has comes from stocks markets, raising on speculation the ECB will have to embrace QE sooner than expected. Technically the 1 hour chart shows price consolidating in a tight 30 pips range above its 20 SMA, while indicators turned flat also in positive territory. In the 4 hours chart indicators had corrected oversold readings, but are now turning lower below their midlines, in line with the dominant bearish trend.
Support levels: 1.2220 1.2190 1.2150
Resistance levels: 1.2270 1.2300 1.2335
GBP/USD Current price: 1.5619
View Live Chart for the GBP/USD
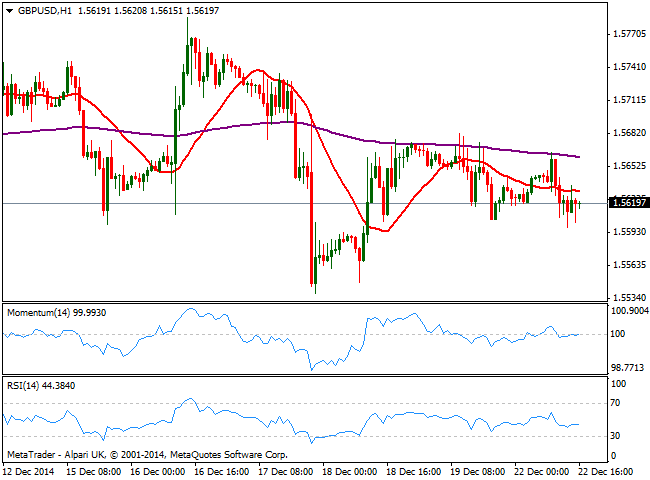
The GBP/USD pair trades near its daily low of 1.5598, also confined to a tight intraday range. The Cable has been pretty much confined to 300 pips since mid November, unable to set up a clear direction, but at least resisting dollars’ strength. Short term, the 1 hour chart shows a mild bearish tone, with the price being capped below its 20 SMA and indicators aiming slightly lower below their midlines. In the 4 hours chart indicators are also biased lower below their midlines, as 20 SMA heads lower above current price.
Support levels: 1.5590 1.5540 1.5500
Resistance levels: 1.5665 1.5700 1.5735
USD/JPY Current price: 119.92
View Live Chart for the USD/JPY
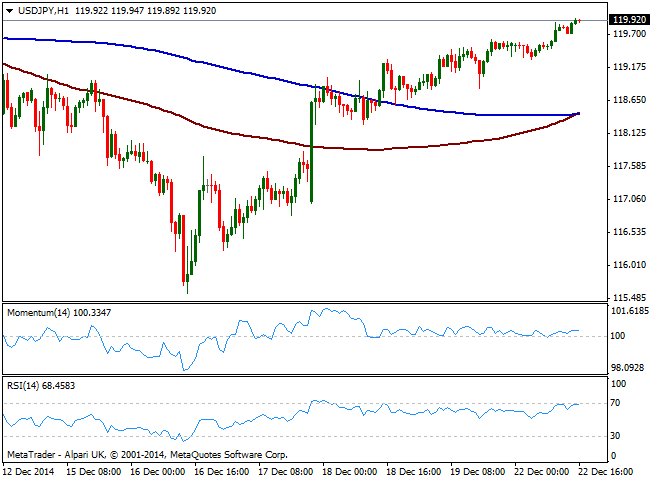
The USD/JPY pair surges alongside with stocks, approaching the 120.00 figure early US hours, albeit lacking momentum due to the inexistent volume across the forex board. Short term, the 1 hour chart shows that indicators hold above their midlines, while 100 SMA approached 200 SMA both below current price at 118.45. In the 4 hours chart, the indicators had turned flat above their midlines accordingly to current market conditions. Nevertheless, the upside is favored with price expected to accelerate some once above 120.00.
Support levels: 119.65 119.30 118.90
Resistance levels: 120.00 120.45 120.85
AUD/USD Current price: 0.8139
View Live Chart of the AUD/USD
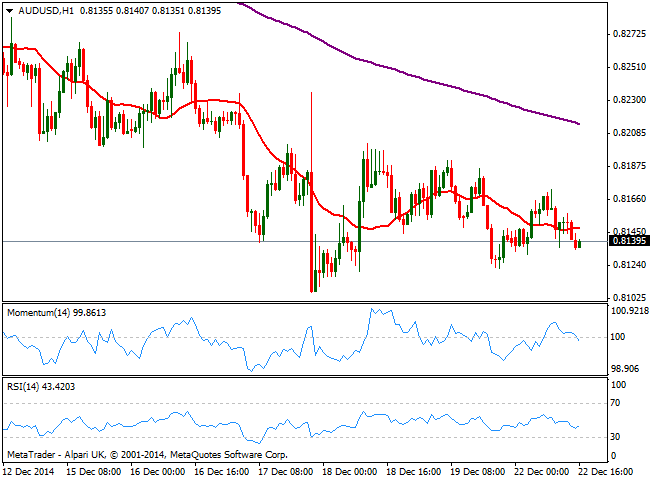
The AUD/USD pair trades around its daily opening, having been as high as 0.8172 on the day. Australian dollar weakness continues to favor the downside in the pair, and so does the 1 hour chart that shows price below its 20 SMA and indicators heading lower below their midlines. In the 4 hours chart the technical picture is also bearish, with immediate support now at 0.8106, multiyear low posted last week.
Support levels: 0.8105 0.8060 0.8025
Resistance levels: 0.8170 0.8200 0.8240
Recommended Content
Editors’ Picks
AUD/USD failed just ahead of the 200-day SMA

Finally, AUD/USD managed to break above the 0.6500 barrier on Wednesday, extending the weekly recovery, although its advance faltered just ahead of the 0.6530 region, where the key 200-day SMA sits.
EUR/USD met some decent resistance above 1.0700

EUR/USD remained unable to gather extra upside traction and surpass the 1.0700 hurdle in a convincing fashion on Wednesday, instead giving away part of the weekly gains against the backdrop of a decent bounce in the Dollar.
Gold keeps consolidating ahead of US first-tier figures

Gold finds it difficult to stage a rebound midweek following Monday's sharp decline but manages to hold above $2,300. The benchmark 10-year US Treasury bond yield stays in the green above 4.6% after US data, not allowing the pair to turn north.
Bitcoin price could be primed for correction as bearish activity grows near $66K area

Bitcoin (BTC) price managed to maintain a northbound trajectory after the April 20 halving, despite bold assertions by analysts that the event would be a “sell the news” situation. However, after four days of strength, the tables could be turning as a dark cloud now hovers above BTC price.
Bank of Japan's predicament: The BOJ is trapped

In this special edition of TradeGATEHub Live Trading, we're joined by guest speaker Tavi @TaviCosta, who shares his insights on the Bank of Japan's current predicament, stating, 'The BOJ is Trapped.'