EUR/USD Current price: 1.2472
View Live Chart for the EUR/USD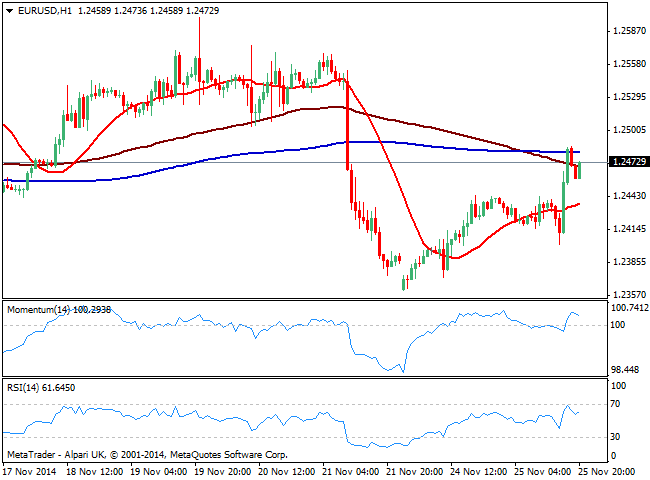
It was quite an active day across the forex board, with the USD finally edging lower despite a strong GDP revision for the 3rd quarter, up to 3.9% from an advance reading of 3.5% and an expected 3.3%. The EUR/USD pair dived down to 1.2400 but failure to break below it alongside with disappointing US Consumer confidence and Richmond Manufacturing Index, both well below expected, overshadowed the encouraging growth report, and triggered a strong bounce to fresh daily highs.
Posting a second day in a row of gains, the pair stalled at 1.2486 20 DMA, trading a handful pips below it as the day comes to an end. In the short term, the 1 hour chart shows price extended above its 20 SMA but hovers now around 100 and 200 SMAs both around current levels and lacking directional strength. Indicators in this last time frame stand in positive territory but lost early upward potential, while in the 4 hours chart indicators head strongly up, crossing their midlines to the upside and suggesting some further advances. Despite the dominant bearish trend, short term risk has then turned to the upside, with a break above 1.2520 exposing the highs in the 1.2560/70 price zone.
Support levels: 1.2440 1.2400 1.2360
Resistance levels: 1.2485 1.2520 1.2560
EUR/JPY Current price: 147.00
View Live Chart for the EUR/JPY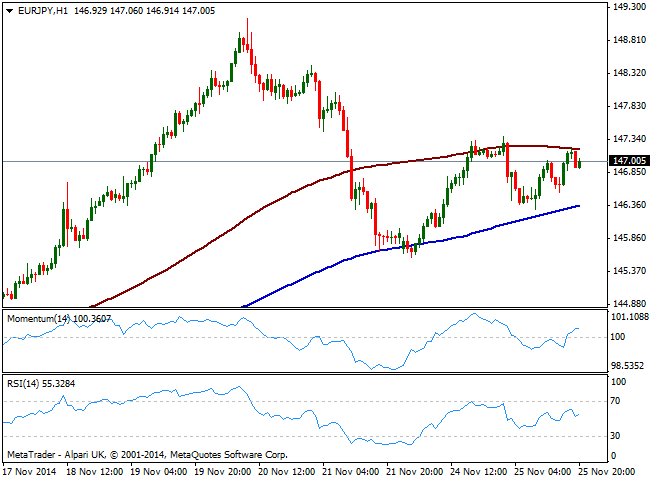
The Japanese yen advanced against most rivals early Tuesday, following the release of BOJ Minutes: policymakers had expressed there their concerns over the cost of QE, while in his speech Gov Kuroda said the fast depreciation of the local currency can hurt households and small firms, putting a halt in yen slides, at least for now: JPY crosses had traded below Monday highs with the EUR/JPY crosses falling down to 146.29 before bouncing in the US session. Technically, the 1 hour chart shows price now capped by its 100 SMA around 147.20 but above 200 one at 146.30 intraday support, as indicators hold in positive territory but showing no directional strength at the time being. In the 4 hours chart however, the technical outlook is more constructive with indicators aiming higher above their midlines: price needs to extend above recent intraday highs around 147.30 to be able to extend its recovery, up to 148.10/20 price zone.
Support levels: 146.40 145.90 145.50
Resistance levels: 147.30 147.65 148.10
GBP/USD Current price: 1.5614
View Live Chart for the GBP/USD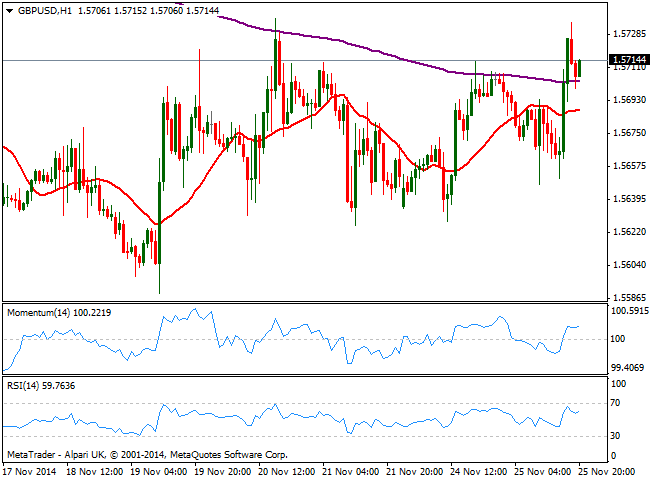
Pound surged against the greenback up to 1.5735, stalling at the top of its recent range. Cable has been consolidating between its year low in the 1.5580/90 region and 1.5740 for eight days in a row, meaning some follow through above the top of the range should signal an interim bottom in place and favor some stronger recoveries. Technically speaking, the 1 hour chart shows a mild positive tone, with price developing above a flat 20 SMA and momentum also horizontal above 100, while RSI advances around 60. In the 4 hours chart the technical picture is also neutral to bullish as indicators stand in positive territory yet lacking strength at the time being. Bigger stops are likely lying above the 1.5770 level, which means an advance above will likely trigger a stronger upward momentum in the pair; buyers in case of retracements, should defend the 1.5660 area to keep hopes of a recovery alive, while below 1.5620 risk will turn south towards fresh year lows.
Support levels: 1.5700 1.5660 1.5620
Resistance levels: 1.5740 1.5770 1.5830
USD/JPY Current price: 117.79
View Live Chart for the USD/JPY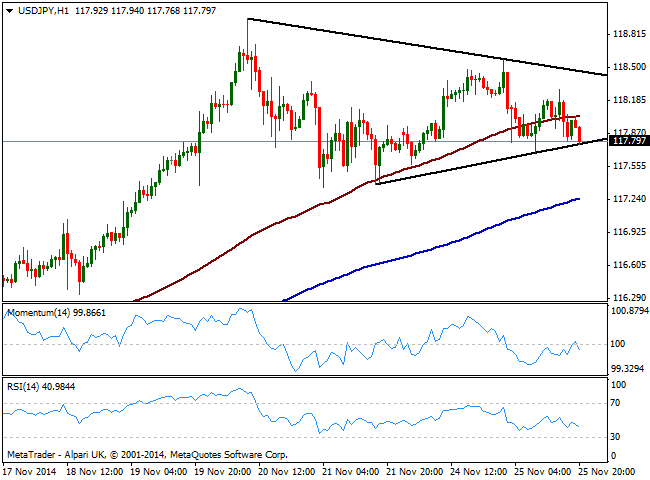
Latest BOJ Minutes had put a brake in yen slide, and USD/JPY buyers had take a step aside: the pair pressures its daily low by US session close, with the 1 hour chart showing price extending below 100 SMA and about to break a short term ascendant trend line, whilst indicators head lower below their midlines, suggesting further declines ahead. In the 4 hours chart indicators are about to close their midlines with a clear bearish slope, supporting the shorter term view: immediate short term target stands around 117.30/40 where the pair presents several intraday lows that triggered recoveries during the last week; if the level finally eases, the downward corrective movement can extend down to 116.33, November 18th daily low. To the upside, a descendant trend line coming from this year high at 118.97 stands now at 118.40 and the pair needs to break above it to shrug off the bearish tone.
Support levels: 117.35 117.00 116.65
Resistance levels: 118.00 118.40 118.90
AUD/USD Current price: 0.8532
View Live Chart of the AUD/USD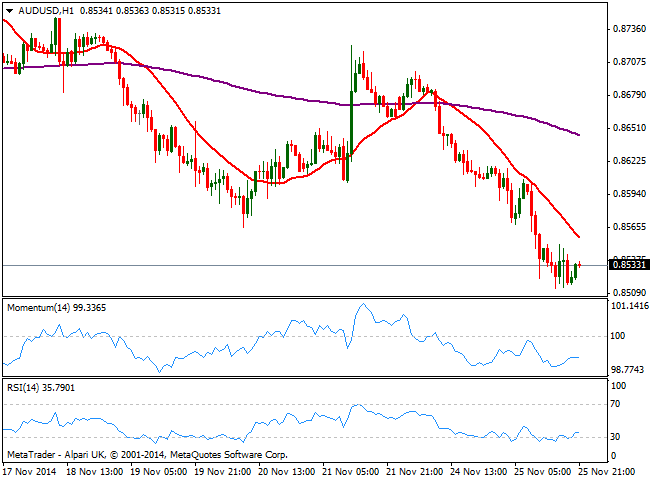
Aussie trades at fresh 4-year lows against the greenback, having been under pressure ever since the day started. The AUD/USD fell mid European morning, following comments from Reserve Bank of Australia deputy governor Philip Lowe suggesting that the RBA could be more active in its targeting of the exchange rate: the Central Bank has been largely jawboning on a weaker Aussie being helpful from a macroeconomic perspective. Ahead of Asian opening, the pair trades a few pips above the daily low set at 0.8513, with the 1 hour chart showing a strongly bearish 20 SMA now offering short term resistance around 0.8550, while indicators turned back south after partially correcting oversold readings. In the 4 hours chart indicators maintain a strong bearish momentum hovering now around oversold levels. Further declines below 0.8500 could trigger a selloff in the pair, with 0.8316, July 2010 monthly low coming at sight midterm.
Support levels: 0.8500 0.8470 0.8425
Resistance levels: 0.8550 0.8590 0.8635
Recommended Content
Editors’ Picks
AUD/USD posts gain, yet dive below 0.6500 amid Aussie CPI, ahead of US GDP

The Aussie Dollar finished Wednesday’s session with decent gains of 0.15% against the US Dollar, yet it retreated from weekly highs of 0.6529, which it hit after a hotter-than-expected inflation report. As the Asian session begins, the AUD/USD trades around 0.6495.
USD/JPY finds its highest bids since 1990, approaches 156.00

USD/JPY broke into its highest chart territory since June of 1990 on Wednesday, peaking near 155.40 for the first time in 34 years as the Japanese Yen continues to tumble across the broad FX market.
Gold stays firm amid higher US yields as traders await US GDP data

Gold recovers from recent losses, buoyed by market interest despite a stronger US Dollar and higher US Treasury yields. De-escalation of Middle East tensions contributed to increased market stability, denting the appetite for Gold buying.
Ethereum suffers slight pullback, Hong Kong spot ETH ETFs to begin trading on April 30

Ethereum suffered a brief decline on Wednesday afternoon despite increased accumulation from whales. This follows Ethereum restaking protocol Renzo restaked ETH crashing from its 1:1 peg with ETH and increased activities surrounding spot Ethereum ETFs.
Dow Jones Industrial Average hesitates on Wednesday as markets wait for key US data

The DJIA stumbled on Wednesday, falling from recent highs near 38,550.00 as investors ease off of Tuesday’s risk appetite. The index recovered as US data continues to vex financial markets that remain overwhelmingly focused on rate cuts from the US Fed.