EUR/USD Current price: 1.2522
View Live Chart for the EUR/USD
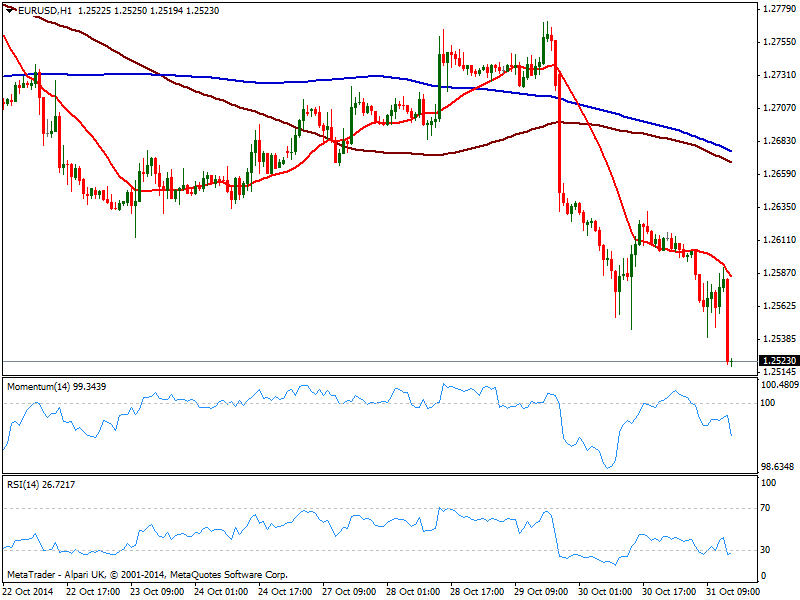
The EUR/USD approaches quickly to its year low of 1.2501 ahead of US opening, posting a fresh daily low of 1.2521 at the time of writing. The movement came despite US consumer spending fell in September for the first time in eight months, down to -0.2% alongside with a small pullback also in incomes: markets are nothing about data today, but about Central Banks imbalances: as the FED gave a farewell to QE, the Bank of Japan announced an increase its one, while the ECB is expected o launch its ABC program next week.
Technically, the 1 hour chart shows price having found resistance at a bearish 20 SMA while indicators turned south deep in the red. In the 4 hours chart technical readings maintain a strong bearish momentum despite in oversold territory, with a break below 1.2500 probably triggering stop and fueling the slide down to 1.2440 price zone.
Support levels: 1.2500 1.2440 1.2370
Resistance levels: 1.2560 1.2620 1.2660
GBP/USD Current price: 1.5962
View Live Chart for the GBP/USD
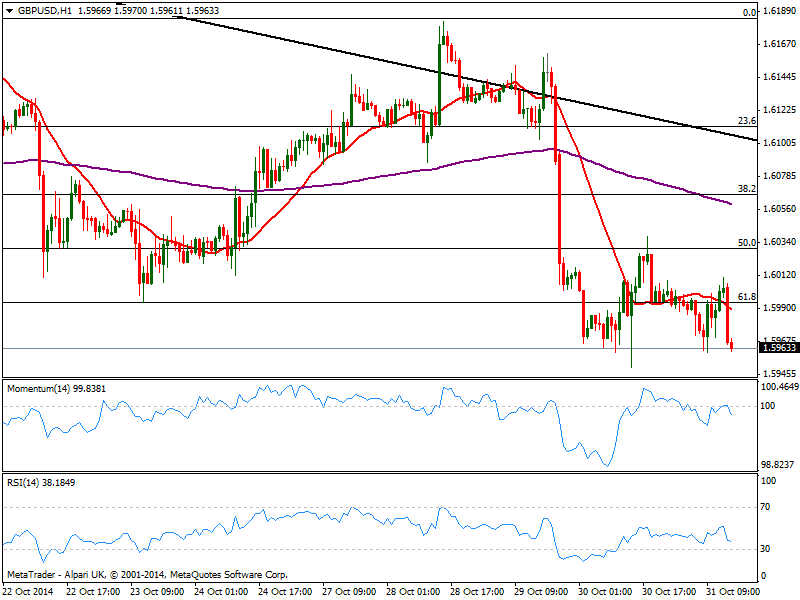
The GBP/USD also resumed its slide after flirting with the 50.0% retracement of its latest bullish run late Thursday, accelerating south as US players come to join the party. The 1 hour chart shows a strong bearish momentum as per current candle downward acceleration below its 20 SMA, while indicators turned strongly south into negative territory. In the 4 hours chart technical readings also present a bearish bias, suggesting further declines below the weekly low of 1.5950 should accelerate the selloff towards the month low of 1.5874
Support levels: 1.5950 1.5910 1.5875
Resistance levels: 1.6000 1.6035 1.6060
USD/JPY Current price: 111.91
View Live Chart for the USD/JPY
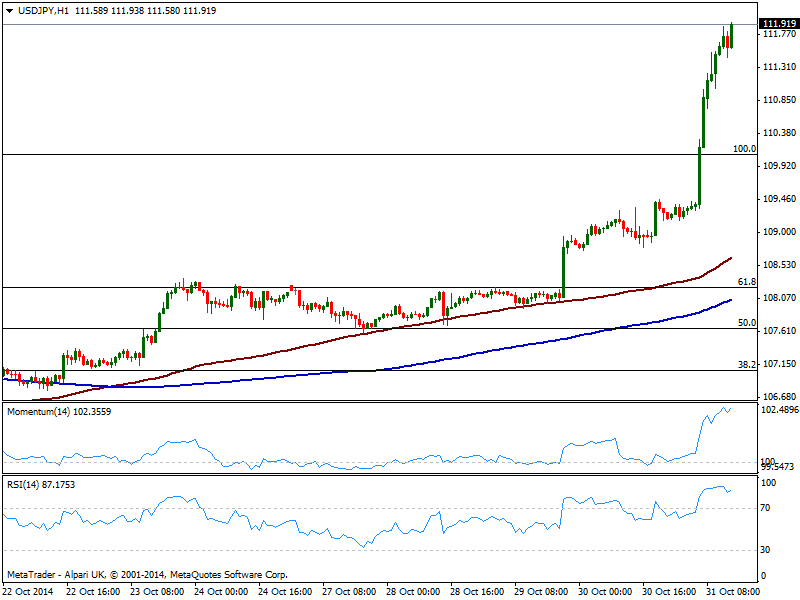
Unstoppable USD/JPY approaches 112.00, having added over 260 pips after BOJ’s decision to increase its monetary easing program, from previous ¥60-70-trillion to a total of¥80-trillion. Technically, the 1 and 4 hours charts shows extreme overbought reading coming from technical indicators, yet price posts higher highs without looking back, far from suggesting exhaustion or a trend change. Trading at levels not seen since 2008, the pair is not known for its ability of making pullbacks: once a trend starts, it doesn’t look back: some steady consolidation above 112.00 should favor further advances, although extreme cautious is recommended at this point.
Support levels: 111.55 111.20 110.80
Resistance levels: 112.00 112.45 112.90
AUD/USD Current price: 0.8785
View Live Chart of the AUD/USD
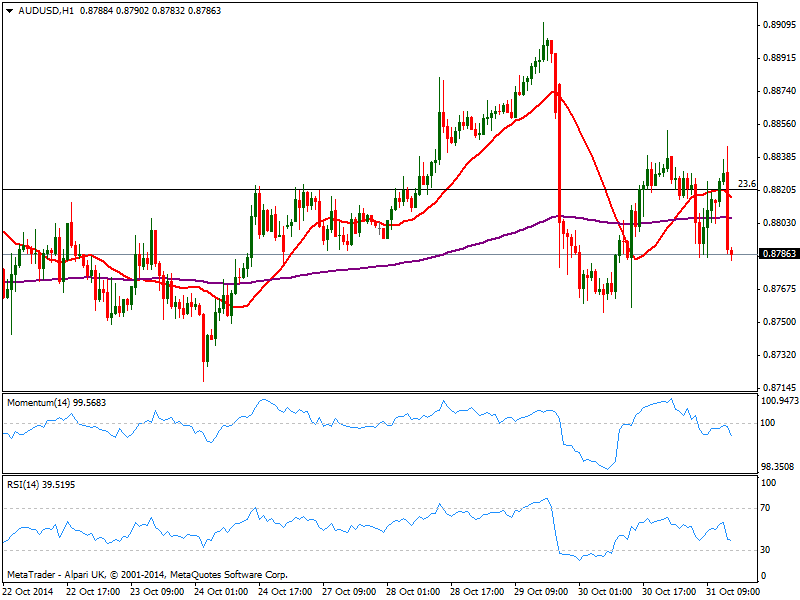
Despite the strong run in stocks, Aussie also capitulates against the greenback as gold trades at a fresh 4 year low. The 1 hour chart shows another failure attempt to break above 0.8820 as price approaches 0.8870 immediate support, with indicators heading lower below their midlines and 20 SMA capping the upside around mentioned Fibonacci resistance. In the 4 hours chart 20 SMA stands flat also around 0.8820, while indicators turned lower below their midlines, supporting further falls.
Support levels: 0.8770 0.8730 0.8690
Resistance levels: 0.8820 0.8850 0.8890
Recommended Content
Editors’ Picks
AUD/USD could extend the recovery to 0.6500 and above

The enhanced risk appetite and the weakening of the Greenback enabled AUD/USD to build on the promising start to the week and trade closer to the key barrier at 0.6500 the figure ahead of key inflation figures in Australia.
EUR/USD now refocuses on the 200-day SMA

EUR/USD extended its positive momentum and rose above the 1.0700 yardstick, driven by the intense PMI-led retracement in the US Dollar as well as a prevailing risk-friendly environment in the FX universe.
Gold struggles around $2,325 despite broad US Dollar’s weakness

Gold reversed its direction and rose to the $2,320 area, erasing a large portion of its daily losses in the process. The benchmark 10-year US Treasury bond yield stays in the red below 4.6% following the weak US PMI data and supports XAU/USD.
Bitcoin price makes run for previous cycle highs as Morgan Stanley pushes BTC ETF exposure

Bitcoin (BTC) price strength continues to grow, three days after the fourth halving. Optimism continues to abound in the market as Bitcoiners envision a reclamation of previous cycle highs.
US versus the Eurozone: Inflation divergence causes monetary desynchronization

Historically there is a very close correlation between changes in US Treasury yields and German Bund yields. This is relevant at the current juncture, considering that the recent hawkish twist in the tone of the Federal Reserve might continue to push US long-term interest rates higher and put upward pressure on bond yields in the Eurozone.