EUR/USD Current price: 1.3129
View Live Chart for the EUR/USD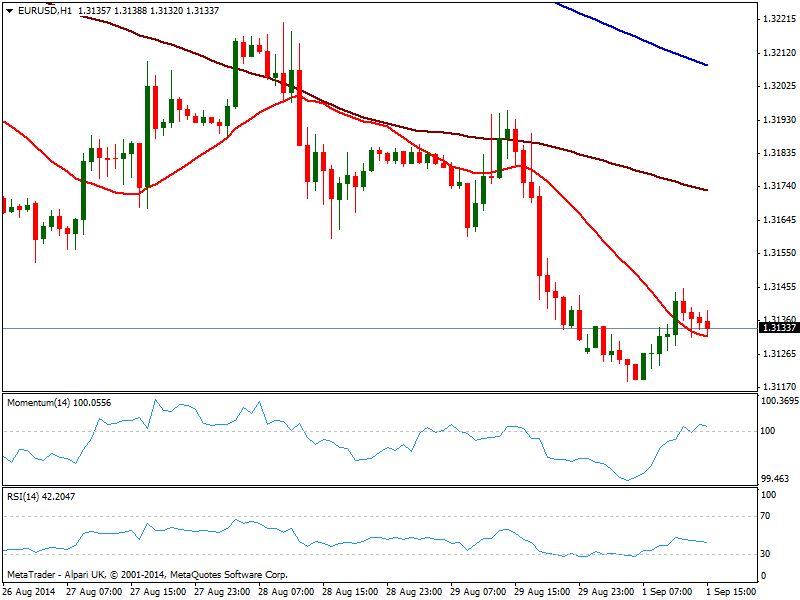
Monday passed by, adding nothing new to the general outlook of currencies, with thin conditions due to Labor Day in the US and the expectation on ECB, BOE and US Payroll numbers by the end of the week. From a fundamental side, in Europe, Markit Manufacturing PMI’s shown the economic contraction continues, with most of the local numbers down, EZ one to 50.7 and French one steady below the line of growth at 46.9. Sentiment around the EUR remains strongly bearish, with latest COT report showing net short now at their largest since July 2013, on speculation the ECB will do further easing. USD longs rose to levels also not seen over a year, mostly against EUR and JPY shorts.
The EUR/USD traded in between 1.3119 fresh year low and 1.3145, with the hourly chart showing indicators corrected all of their oversold conditions and turning horizontal around their midlines, and price right below a flat 20 SMA, maintaining a quite neutral stance. In the 4 hours chart indicators maintain a strong bearish tone approaching oversold levels, as 20 SMA stands now around 1.3170 acting as intraday resistance in case of recoveries. There’s little to expect from the pair until the afore mentioned data, albeit a break lower is favored with critical support at 1.3105, September 2013 monthly low.
Support levels: 1.3105 1.3090 1.3050
Resistance levels: 1.3145 1.3170 1.3215
EUR/JPY Current price: 136.94
View Live Chart for the EUR/JPY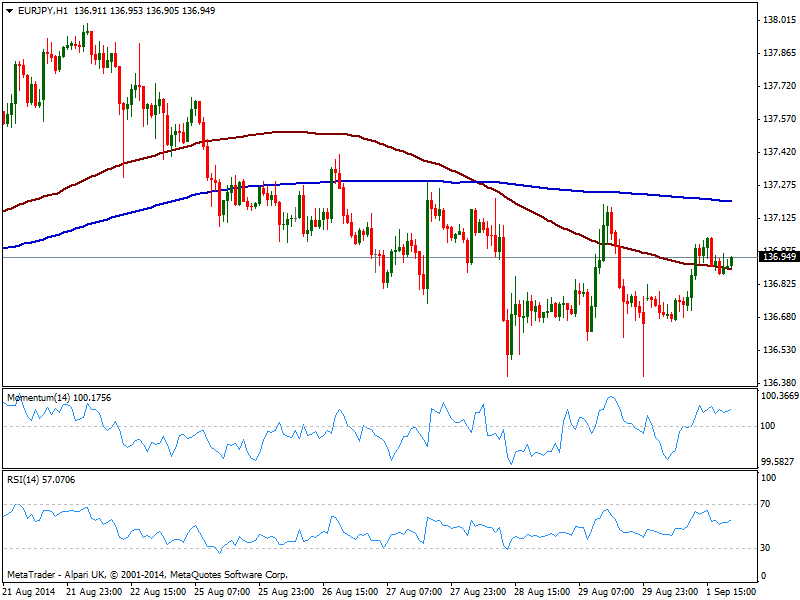
The EUR/JPY corrected higher all though this Monday, stalling however around the 137.00 figure. As a new day starts, the hourly chart shows price struggling to hold above its 100 SMA, while indicators continue to grind higher in positive territory, supporting further short term gains. In the 4 hours chart however, the pair stalled where 100 and 200 SMAs converge, as indicators begin to retrace from their midlines, supporting the idea of the latest bullish run being a short term upward corrective movement. Further advances with price settling above 137.30 will suggests a continued advance over the upcoming hours, while a price acceleration below 136.90 will likely favor a slide towards 136.40 support zone.
Support levels: 136.90 136.40 136.00
Resistance levels: 137.30 137.60 138.00
GBP/USD Current price: 1.6610
View Live Chart for the GBP/USD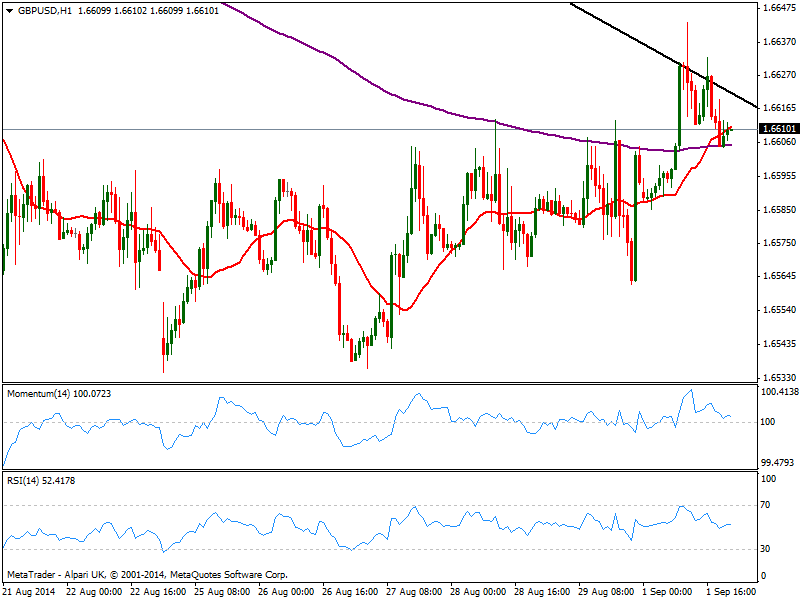
Pound saw some early demand probably lead by EUR/GBP selling, reaching 1.6643 against the greenback right before the release of UK Manufacturing PMI: as data missed expectations, the pair eased back consolidating for the rest of the day below the daily descendant trend line coming from this year high of 1.7190. The hourly chart shows a couple spikes above it but the fact is that so far, price was unable to establish above it. Furthermore, momentum has lost its upward strength and grinded lower nearing its midline, while RSI stands in neutral territory, all of which helps keep the upside limited. In the 4 hours chart technical readings maintain the neutral tone seen over the past few days despite the higher high of the week, with the pair also waiting for economic developments before setting a clearer trend.
Support levels: 1.6600 1.6570 1.6540
Resistance levels: 1.6630 1.6665 1.6700
USD/JPY Current price: 104.28
View Live Chart for the USD/JPY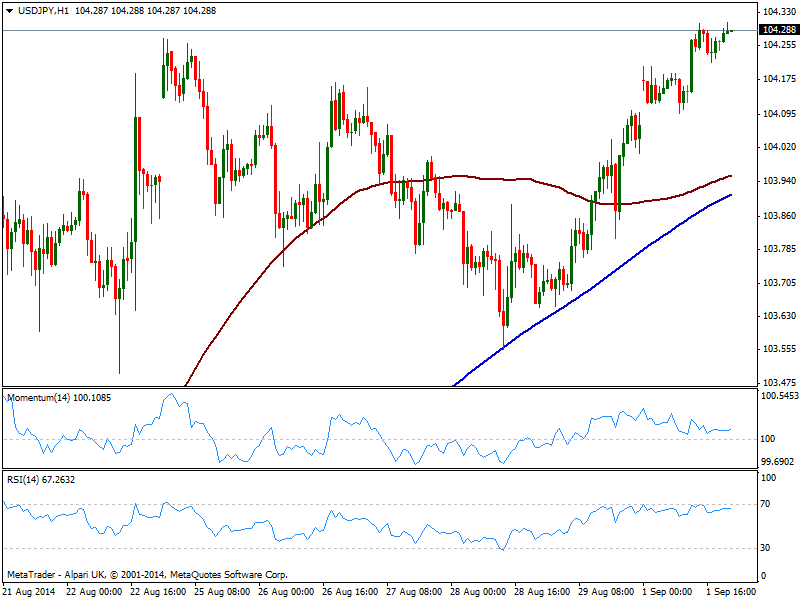
The USD/JPY established a fresh 8-month high of 104.30, where it stood for most of the last two sessions. The year high set in January this year stands at 105.43, probable magnet target in case of more dollar gains over the upcoming days. In the meantime, the short term picture shows indicators maintaining a neutral stance, with 100 and 200 SMA’s now converging in the 103.90 price zone immediate support. In the 4 hours chart indicators present a stronger upward tone, with RSI entering overbought territory, not yet suggesting a bearish correction. With no activity in US stocks markets, and European indexes barely changed on the day, local share markets can imprint some motion to the FX board, albeit more thin ranges should not be a surprise until Thursday.
Support levels: 103.90 103.60 103.35
Resistance levels: 104.30 104.50 104.80
AUD/USD Current price: 0.9332
View Live Chart of the AUD/USD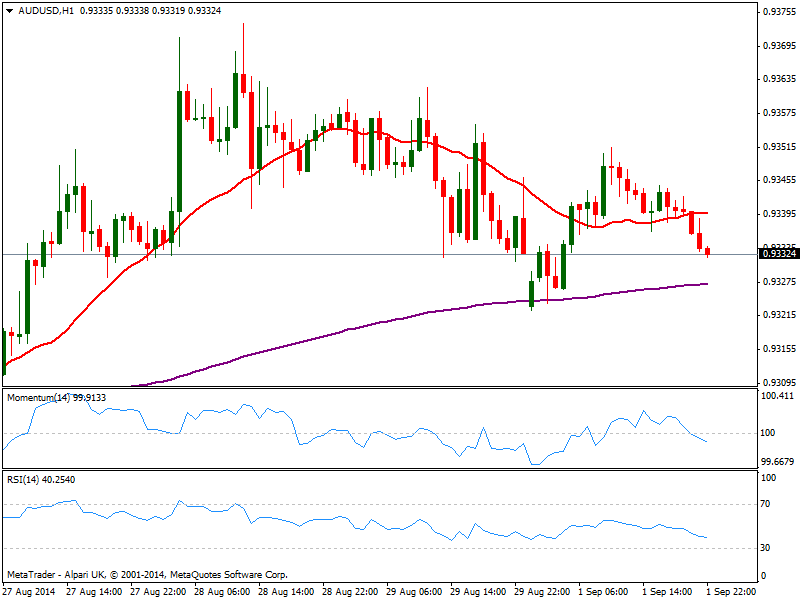
Aussie eased early Asia, anticipating to RBA meeting probable outcome: the Central Bank is expected to remain on hold, and further down talking of the currency coming from Governor Glenn Stevens. Along with the meeting, the country will release housing and current account data, which guarantees some action over the session. Technically the pair is gaining short term bearish tone, with the hourly chart showing price below a flat 20 SMA and indicators grinding lower in negative territory, keeping the pressure to the downside. In the 4 hours chart technical readings also turned south with price barely above 0.9330 critical static support and 200 EMA: a price acceleration through the level should anticipate a stronger decline, with further selling interest below 0.9300 exposing the 0.9260/70 price zone.
Support levels: 0.9330 0.9300 0.9260
Resistance levels: 0.9370 0.9410 0.9450
Recommended Content
Editors’ Picks
EUR/USD clings to daily gains above 1.0650

EUR/USD gained traction and turned positive on the day above 1.0650. The improvement seen in risk mood following the earlier flight to safety weighs on the US Dollar ahead of the weekend and helps the pair push higher.
GBP/USD recovers toward 1.2450 after UK Retail Sales data

GBP/USD reversed its direction and advanced to the 1.2450 area after touching a fresh multi-month low below 1.2400 in the Asian session. The positive shift seen in risk mood on easing fears over a deepening Iran-Israel conflict supports the pair.
Gold holds steady at around $2,380 following earlier spike

Gold stabilized near $2,380 after spiking above $2,400 with the immediate reaction to reports of Israel striking Iran. Meanwhile, the pullback seen in the US Treasury bond yields helps XAU/USD hold its ground.
Bitcoin Weekly Forecast: BTC post-halving rally could be partially priced in Premium

Bitcoin price shows no signs of directional bias while it holds above $60,000. The fourth BTC halving is partially priced in, according to Deutsche Bank’s research.
Week ahead – US GDP and BoJ decision on top of next week’s agenda

US GDP, core PCE and PMIs the next tests for the Dollar. Investors await BoJ for guidance about next rate hike. EU and UK PMIs, as well as Australian CPIs also on tap.