EUR/USD Current price: 1.3325
View Live Chart for the EUR/USD
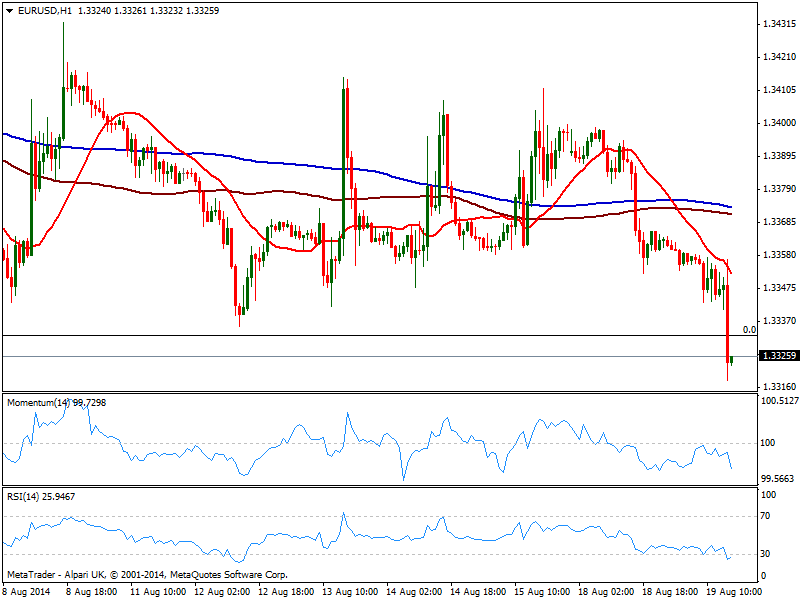
The EUR/USD is down, having posted so far a fresh year low of 1.3313 after the release of US data: inflation rose 0.1% in July, up 2.0% on the year as expected, while housing data shown housing starts surged in July to the highest level in eight months, along with building permits. Numbers prove US growth remains steady widening the breach with European deflationary pressures. Technically, the downward potential gained shape, with the hourly chart showing 20 SMA containing advances earlier on the day, and price below previous low of 1.3332 now immediate resistance. Indicators in the same time frame present a strong bearish tone, while the 4 hours chart also shows indicators biased lower. Immediate target comes around 1.3300, with a break below exposing 1.3250 area for today.
Support levels: 1.3295 1.3250 1.3210
Resistance levels: 1.3332 1.3370 1.3405
GBP/USD Current price: 1.6631
View Live Chart for the GBP/USD
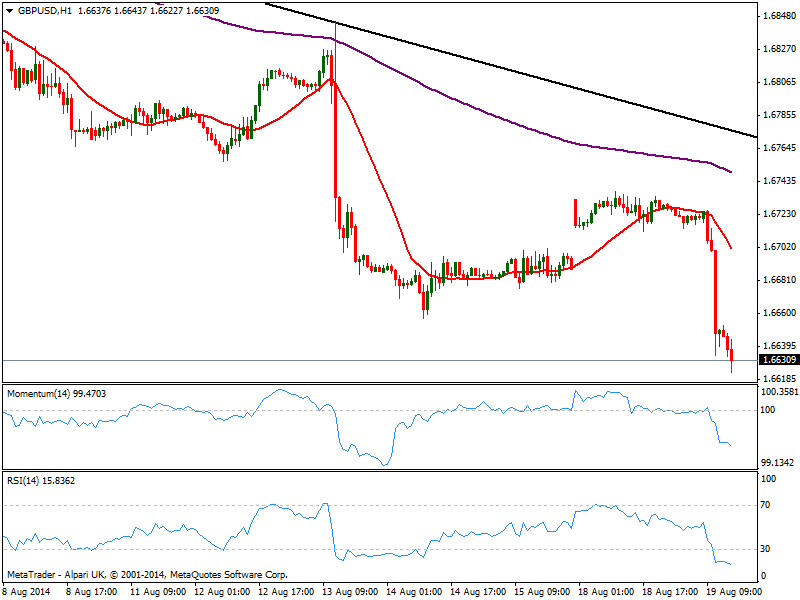
Pound selloff was triggered by poor UK data, with inflation down to 1.6% yearly basis, diminishing chances of a sooner rate hike. Dollar latest strength pushed GBP/USD down to 1.6615, with the pair presenting a strong bearish tone in the short term, as the hourly chart shows indicators heading south despite in oversold levels, while the 4 hours chart shows also a strong downward potential coming from technical readings, supporting a continued slide for the rest of the day.
Support levels: 1.6610 1.6580 1.6545
Resistance levels: 1.6650 1.6700 1.6740
USD/JPY Current price: 102.71
View Live Chart for the USD/JPY
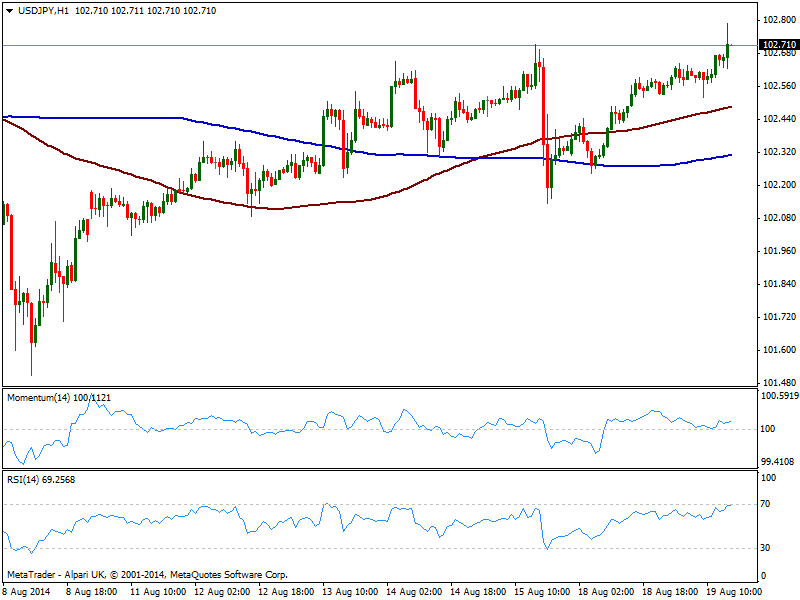
The USD/JPY trades higher but limited, having surged up to 102.79 with early US news, but lacking upward potential according with short term technical readings: the 1 hour chart shows indicators flat in positive territory, albeit price stands above its moving averages. In the 4 hours chart a mild positive tone is also present, with critical resistance now around 102.85, a daily descendant trend line coming from this year high.
Support levels: 102.35 101.95 101.60
Resistance levels: 102.85 103.10 103.45
AUD/USD Current price: 0.9325
View Live Chart for the AUD/USD
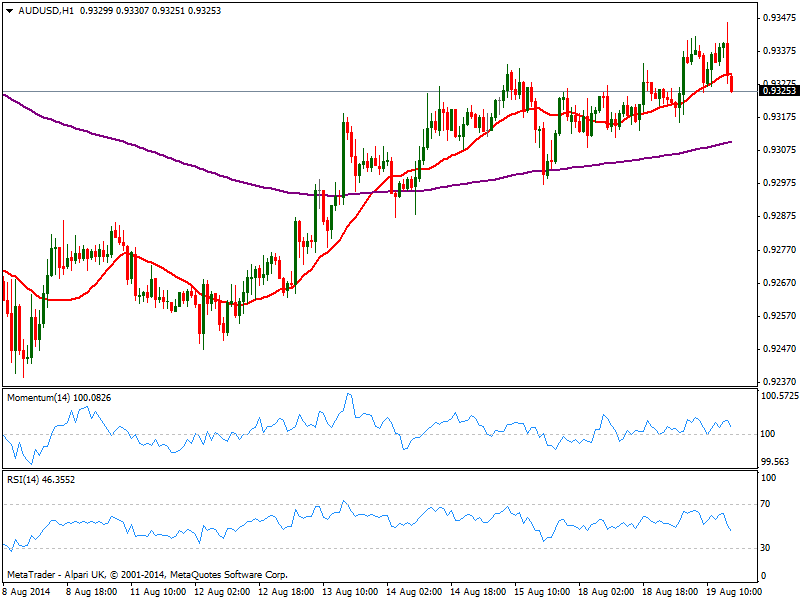
The AUD/USD advanced up to 0.9346, supported over Asian hours by RBA Minutes, not as dovish as market expected. But the movement is being reverted early US hours, with the pair trying to break back below the 0.9330 static level. The hourly chart shows price advancing below its 20 SMA while indicators turned lower and approach their midlines. In the 4 hours chart price holds above a bullish 20 SMA while indicators also turned south still above their midlines. Downward risk will increase on a break below 0.9300, favoring then a run towards 0.9260 price zone.
Support levels: 0.9300 0.9260 0.9220
Resistance levels: 0.9330 0.9370 0.9410
Recommended Content
Editors’ Picks
EUR/USD regains traction, recovers above 1.0700

EUR/USD regained its traction and turned positive on the day above 1.0700 in the American session. The US Dollar struggles to preserve its strength after the data from the US showed that the economy grew at a softer pace than expected in Q1.
GBP/USD returns to 1.2500 area in volatile session

GBP/USD reversed its direction and recovered to 1.2500 after falling to the 1.2450 area earlier in the day. Although markets remain risk-averse, the US Dollar struggles to find demand following the disappointing GDP data.
Gold climbs above $2,340 following earlier drop

Gold fell below $2,320 in the early American session as US yields shot higher after the data showed a significant increase in the US GDP price deflator in Q1. With safe-haven flows dominating the markets, however, XAU/USD reversed its direction and rose above $2,340.
XRP extends its decline, crypto experts comment on Ripple stablecoin and benefits for XRP Ledger

Ripple extends decline to $0.52 on Thursday, wipes out weekly gains. Crypto expert asks Ripple CTO how the stablecoin will benefit the XRP Ledger and native token XRP.
After the US close, it’s the Tokyo CPI

After the US close, it’s the Tokyo CPI, a reliable indicator of the national number and then the BoJ policy announcement. Tokyo CPI ex food and energy in Japan was a rise to 2.90% in March from 2.50%.