EUR/USD Current price: 1.3440
View Live Chart for the EUR/USD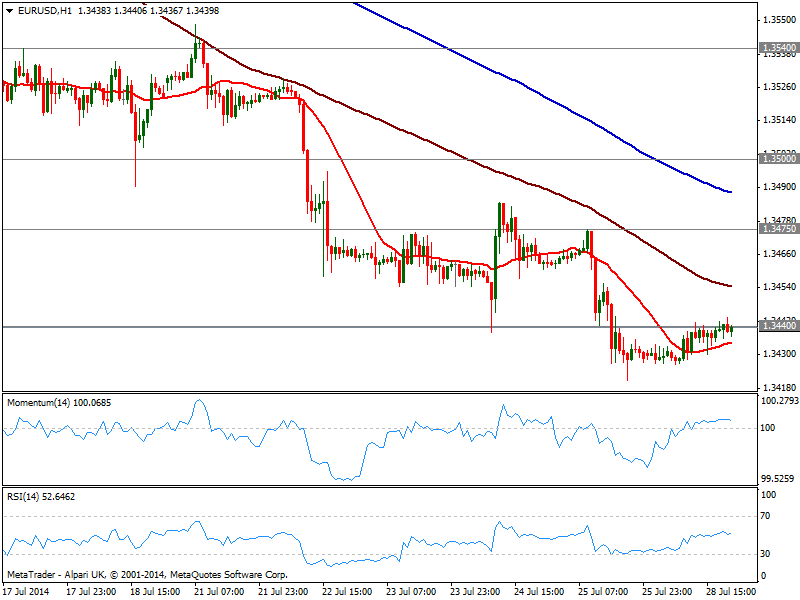
Market has, as expected, been ultra thin this Monday, with majors mostly confined in 20/30 pips ranges: there were no major news coming from Europe, and in the US disappointing data was not enough to affect investors, that wait for the deluge of economic reports coming from the US starting on Wednesday. The big focus will be FOMC meeting albeit chances of a surprise there are limited: the only way the FED can rock markets is by announcing a sooner than expected rate hike, something pretty unlikely coming from ultra dovish Yellen.
Anyway and from a technical point of view, the EUR/USD held near its year lows, advancing some of US negative fundamental readings, but clearly unable to advance beyond 1.3440 static resistance level. The hourly chart shows a mild positive tone coming from technical readings, neutral for the most, while the 4 hours chart maintains the bearish tone as per price developing below moving averages and momentum heading south below its midline. An upward correction can’t be ruled out, yet sellers are probably waiting in the 1.3475 area, preventing the pair from advancing further.
Support levels: 1.3410 1.3380 1.3335
Resistance levels: 1.3440 1.3475 1.3500
EUR/JPY Current price: 136.87
View Live Chart for the EUR/JPY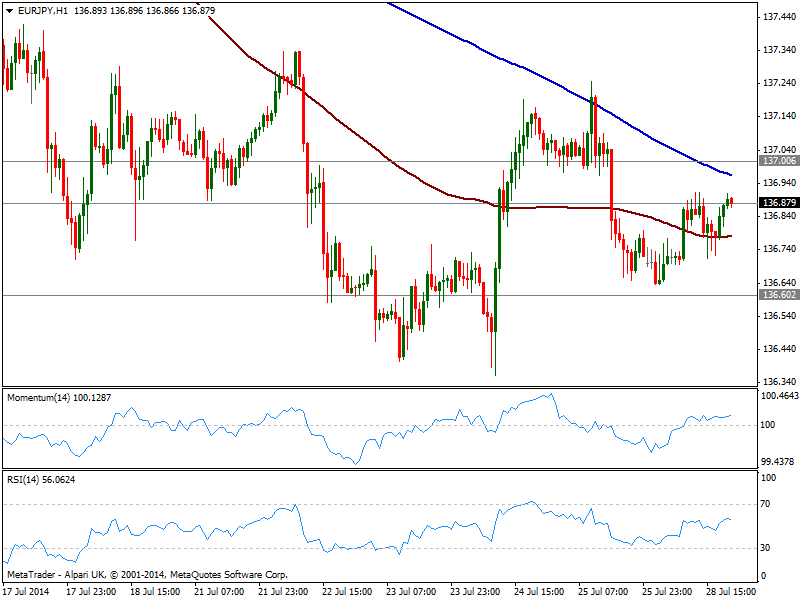
US 10y yields stand around the daily high of 2.49% by the end of the American session, putting yen under some mild bearish pressure against most rivals. Stocks point to close unchanged, giving little clues for upcoming Asian session from that front, but some Japanese data in the form of housing data may shed some light. Short term, the hourly chart shows price advanced a few pips, trading between 100 and 200 SMAs, both with a bearish slope, as indicators stand flat in positive territory. In the 4 hours chart technical readings present a neutral stance, as indicators hover around their midlines directionless. The downside remains favored, with a price acceleration below 136.60 leading to a quick test of 136.20 critical support zone.
Support levels: 136.90 136.60 136.20
Resistance levels: 137.50 137.90 138.40
GBP/USD Current price: 1.6983
View Live Chart for the GBP/USD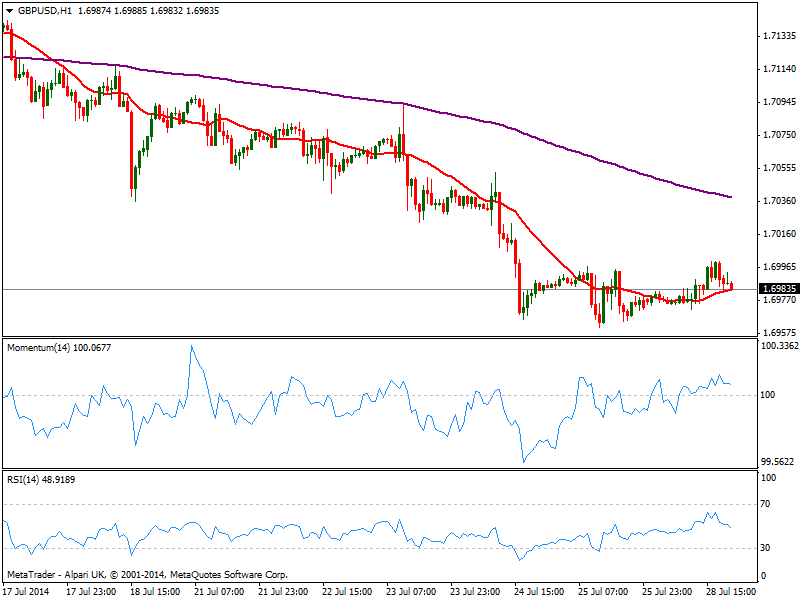
The GBP/USD tested 1.7000 early US session, but also traded in a tight limited range for most of the day which left the hourly chart with little clues on upcoming direction. Indicators in the mentioned time frame turned slightly lower but stand above their midlines, while price hovers around a flat 20 SMA. In the 4 hours chart 20 SMA contained the upside, offering dynamic resistance around mentioned daily high, while indicators hold below their midlines, still keeping the pressure to the downside. Nevertheless, a break below 1.6950 is required to confirm a new leg down towards the 1.6900/10 price zone.
Support levels: 1.6950 1.6920 1.6870
Resistance levels: 1.7010 1.7055 1.7095
USD/JPY Current price: 101.84
View Live Chart for the USD/JPY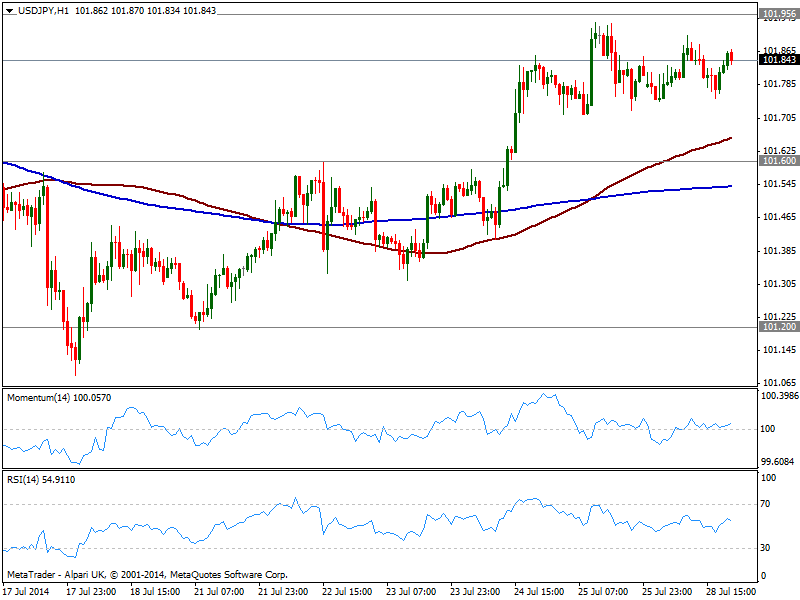
The USD/JPY has been no exception, and traded uneventfully below 101.90, with the hourly chart now showing a mild positive tone, as per price developing above moving averages and indicators standing in positive territory. In the 4 hours chart indicators stand in positive territory but turning lower, while moving averages maintain a bearish slope albeit below current price. Risk to the downside will likely increase on a break below 101.60, but bulls may take their chances on an advance beyond the 102.00 mark.
Support levels: 101.60 101.20 101.05
Resistance levels: 101.95 102.35 102.80
AUD/USD Current price: 0.9407
View Live Chart for the AUD/USD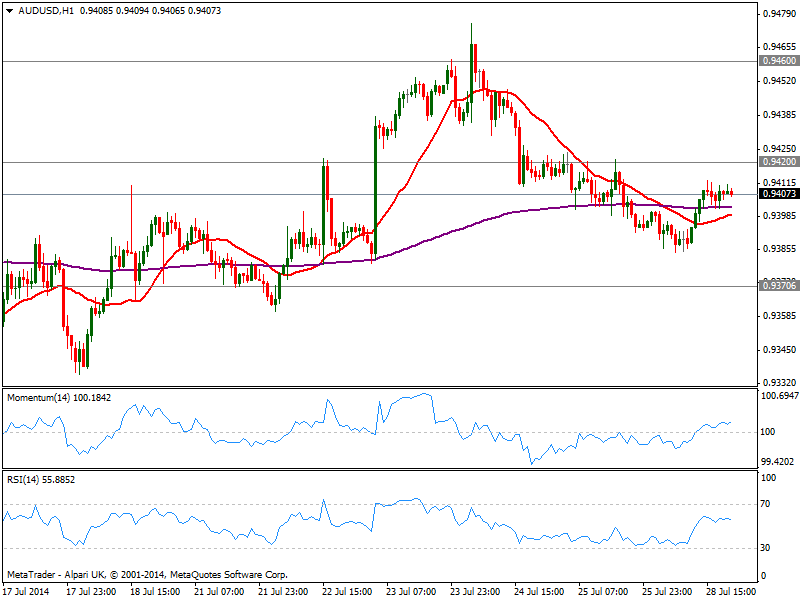
The AUD/USD traded below the 0.9420 mark, presenting however a mild positive short term tone, as per the hourly chart showing indicators aiming higher in positive territory and price above moving averages. In the 4 hours however, the bearish tone prevails as 20 SMA heads lower around mentioned 0.9420 strong static resistance level, while indicators stand below their midlines, directionless. Local housing data can affect the pair temporarily over Asian hours, yet with little expectation of triggering wide moves, ahead of major events later on the week.
Support levels: 0.9370 0.9330 0.9300
Resistance levels: 0.9420 0.9460 0.9500
Recommended Content
Editors’ Picks
EUR/USD clings to daily gains above 1.0650

EUR/USD gained traction and turned positive on the day above 1.0650. The improvement seen in risk mood following the earlier flight to safety weighs on the US Dollar ahead of the weekend and helps the pair push higher.
GBP/USD recovers toward 1.2450 after UK Retail Sales data

GBP/USD reversed its direction and advanced to the 1.2450 area after touching a fresh multi-month low below 1.2400 in the Asian session. The positive shift seen in risk mood on easing fears over a deepening Iran-Israel conflict supports the pair.
Gold holds steady at around $2,380 following earlier spike

Gold stabilized near $2,380 after spiking above $2,400 with the immediate reaction to reports of Israel striking Iran. Meanwhile, the pullback seen in the US Treasury bond yields helps XAU/USD hold its ground.
Bitcoin Weekly Forecast: BTC post-halving rally could be partially priced in Premium

Bitcoin price shows no signs of directional bias while it holds above $60,000. The fourth BTC halving is partially priced in, according to Deutsche Bank’s research.
Week ahead – US GDP and BoJ decision on top of next week’s agenda

US GDP, core PCE and PMIs the next tests for the Dollar. Investors await BoJ for guidance about next rate hike. EU and UK PMIs, as well as Australian CPIs also on tap.