EUR/USD Current price: 1.3415
View Live Chart for the EUR/USD
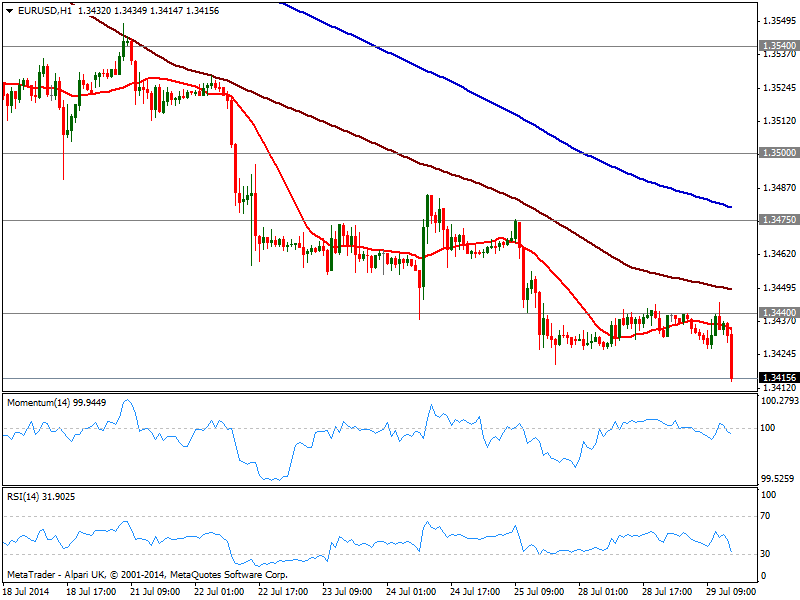
The greenback keeps grinding higher against most rivals, broadly firmer across the board: the EUR/USD below the year low posted last week at 1.3420, accelerating south early US session, and with the hourly chart showing an increasing downward momentum, as price finally moves away from its 20 SMA while indicators head south in negative territory. In the 4 hours chart 20 SMA capped the upside earlier today, a few pips above 1.3440 and immediate resistance, while indicators hold directionless in negative territory. Further slides should be expected in case stops below 1.3410 get triggered, albeit movements will remain limited ahead of upcoming US data starting on Wednesday.
Support levels: 1.3410 1.3380 1.3335
Resistance levels: 1.3440 1.3475 1.3500
GBP/USD Current price: 1.6938
View Live Chart for the GBP/USD
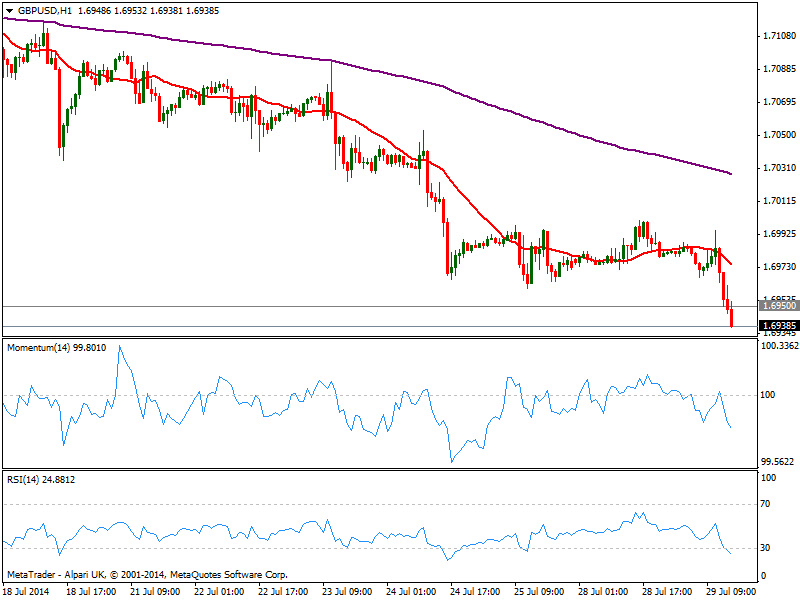
The GBP/USD trades at a new month low having broken below 1.6950, June 26th daily low. The hourly chart shows a strong bearish momentum, with RSI entering negative territory and price well below moving averages, all of which supports a continued slide. In the 4 hours chart indicators stand below their midlines, but lack directional strength; nevertheless the downside is favored towards 1.6900/20 area, as long as mentioned level caps the upside.
Support levels: 1.6920 1.6870 1.6825
Resistance levels: 1.6950 1.7010 1.7055
USD/JPY Current price: 102.03
View Live Chart for the USD/JPY
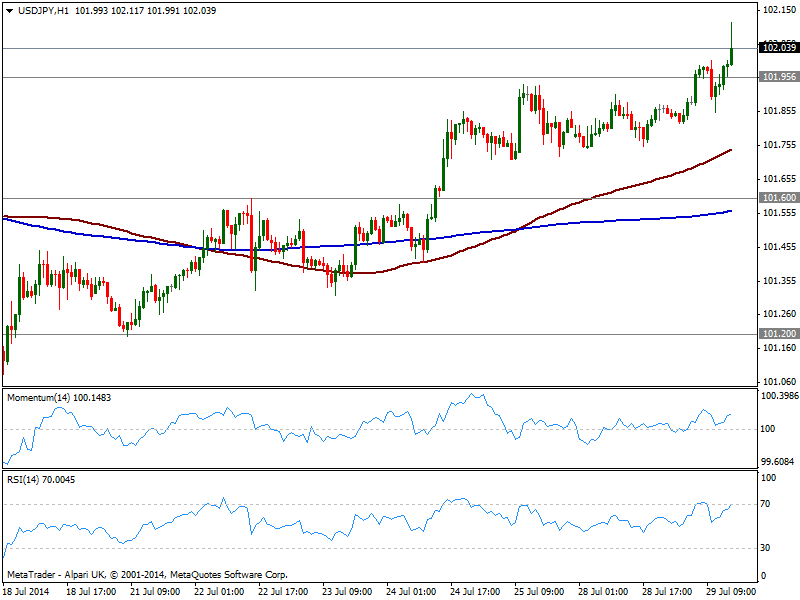
The USD/JPY extended its advance up to 102.11, trading steady above the 102.00 to level but not too far away from it. The hourly chart shows price well above moving averages, with indicators in positive territory, supporting some upward continuation. In the 4 hours chart technical readings also present a mild positive tone, with the upside favored as long as buyers surge on approaches to 101.90/5 support area.
Support levels: 101.95 101.60 101.20
Resistance levels: 102.35 102.80 103.10
AUD/USD Current price: 0.9385
View Live Chart for the AUD/USD
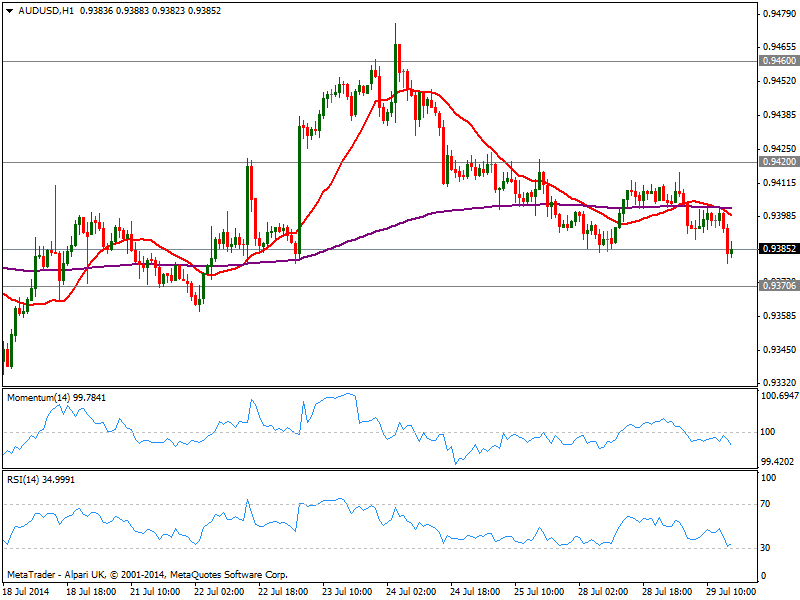
Slightly lower, the AUD/USD approaches 0.9370 support but trades within range. The hourly chart shows indicators heading south below their midlines and price steady below its moving averages, while the 4 hours chart shows also an increasing bearish potential, all of which keeps the pressure to the downside. A break below mentioned support exposes 0.9330 strong static support, probable daily bottom in case of a stronger slide.
Support levels: 0.9370 0.9330 0.9300
Resistance levels: 0.9420 0.9460 0.9500
Recommended Content
Editors’ Picks
AUD/USD posts gain, yet dive below 0.6500 amid Aussie CPI, ahead of US GDP

The Aussie Dollar finished Wednesday’s session with decent gains of 0.15% against the US Dollar, yet it retreated from weekly highs of 0.6529, which it hit after a hotter-than-expected inflation report. As the Asian session begins, the AUD/USD trades around 0.6495.
USD/JPY finds its highest bids since 1990, approaches 156.00

USD/JPY broke into its highest chart territory since June of 1990 on Wednesday, peaking near 155.40 for the first time in 34 years as the Japanese Yen continues to tumble across the broad FX market.
Gold stays firm amid higher US yields as traders await US GDP data

Gold recovers from recent losses, buoyed by market interest despite a stronger US Dollar and higher US Treasury yields. De-escalation of Middle East tensions contributed to increased market stability, denting the appetite for Gold buying.
Ethereum suffers slight pullback, Hong Kong spot ETH ETFs to begin trading on April 30

Ethereum suffered a brief decline on Wednesday afternoon despite increased accumulation from whales. This follows Ethereum restaking protocol Renzo restaked ETH crashing from its 1:1 peg with ETH and increased activities surrounding spot Ethereum ETFs.
Dow Jones Industrial Average hesitates on Wednesday as markets wait for key US data

The DJIA stumbled on Wednesday, falling from recent highs near 38,550.00 as investors ease off of Tuesday’s risk appetite. The index recovered as US data continues to vex financial markets that remain overwhelmingly focused on rate cuts from the US Fed.