EUR/USD Current price: 1.2930
View Live Chart for the EUR/USD
Lots of volatility but little definition was seen in markets today, with majors surging strongly against the greenback early US session with not much behind the movement but yen accelerating against most rivals on falling stocks. US indexes traded in red most of the day, until mid American afternoon FED’s Rosengren talked about maintaining an accommodative police, noticing that with current unemployment and low inflation, tapering is not on the immediate agenda: stocks recovered, and so did the greenback, still closing negatively against most rivals.
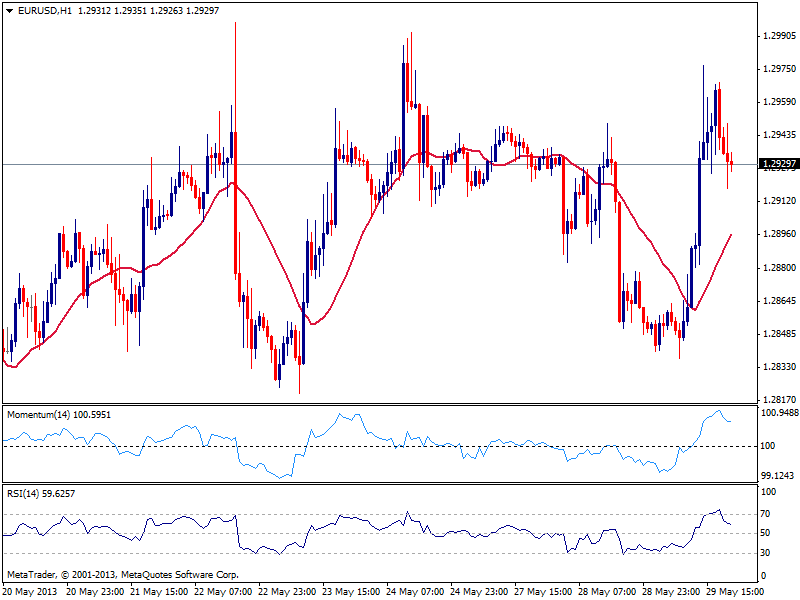
The EUR/USD has traded near both of its range extremes, having been as low as 1.2836 and as high as 1.2976 this Wednesday. Stuck in the 1.2920/1.2950 area for most of the American session, the hourly chart presents a positive tone as momentum heads higher after correcting extreme overbought readings, yet as stated earlier, the 1.2840/1.3000 range will likely hold until next week Central Banks and NFP news.
Support levels: 1.2920 1.2885 1.2840
Resistance levels: 1.2950 1.2990 1.3030
EUR/JPY Current price: 130.80
View Live Chart for the EUR/JPY (select the currency)
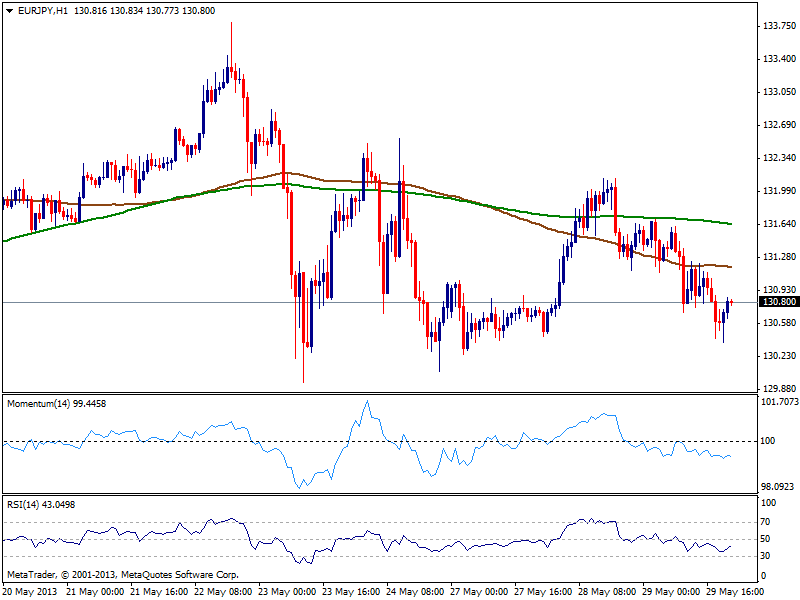
Yen recovered its strength across the board, with the EUR/JPY falling as low as 130.37 before bouncing some with US stocks late recovery. However, the bearish potential has increased after latest failure to regain the upside. The hourly chart shows price developing below 100 and 200 SMAs, while the distance in between both widens, pointing for more downward moves. Technical indicators stand in negative territory, showing not much strength at the time being, but also supporting the downside: 130.20 is the support to watch as once below, the pair has scope to extend its slide towards 128.80 price zone.
Support levels: 130.60 130.20 129.60
Resistance levels: 131.20 131.70 132.10
GBP/USD Current price: 1.5130
View Live Chart for the GBP/USD (select the currency)
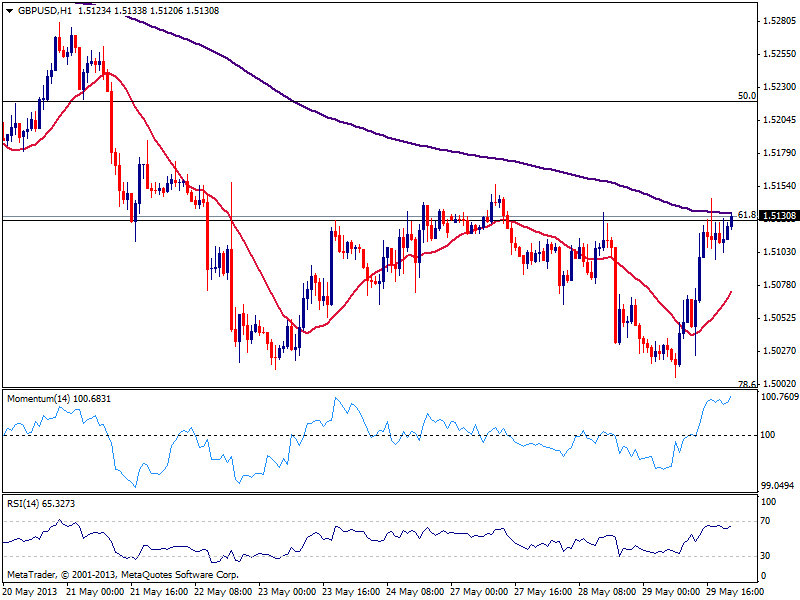
The GBP/USD holds to its daily gains, stuck around 1.5130, strong Fibonacci level, 61.8% retracement of its latest daily run. The hourly chart shows a strong upward momentum coming from indicators after a limited correction, but as long as price does not shows a clear break above this area, the picture remains unclear. Pullbacks should found support around 1.5050/60 area, while only below this last the intraday bias will turn negative.
Support levels: 1.5070 1.5045 1.5010
Resistance levels: 1.5130 1.5175 1.5210
USD/JPY Current price: 101.08
View Live Chart for the USD/JPY (select the currency)
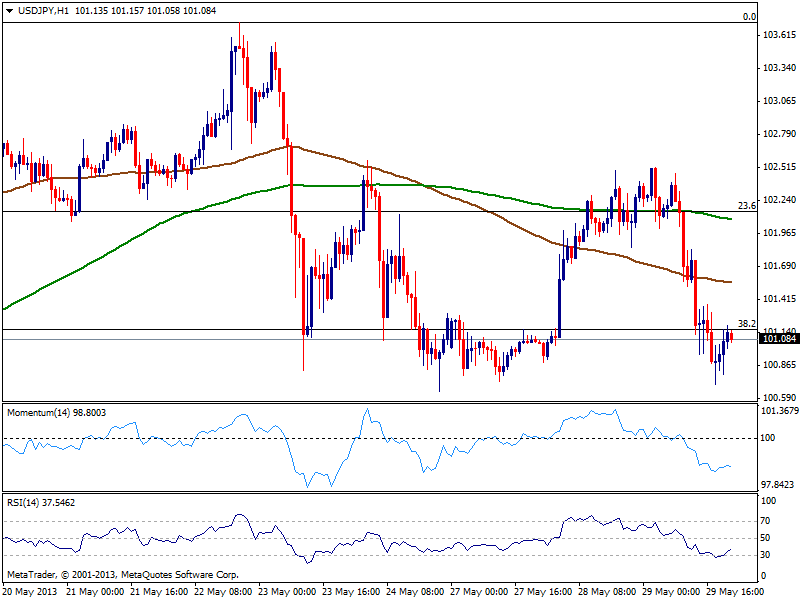
USD/JPY trades again below key 101.20 area, 38.2% retracement of May bullish run. Investors may continue buying dips, but are now rushing to take profits out of the table. And while the long term bullish trend remains in place and there are no much signs of a top underway, downside potential continues to increase. As for the technical picture, the hourly chart shows price back below 100 and 200 SMAs, with the distance between both widening, supporting the bearish bias in the pair. Technical indicators stand in negative territory while bigger time frames show technical indicators turning south, supporting the shorter term view. Break below 100.65, this week low should anticipate further slides with 99.70, former high, then at sight.
Support levels: 101.00 100.65 100.20
Resistance levels 101.25 101.60 101.95
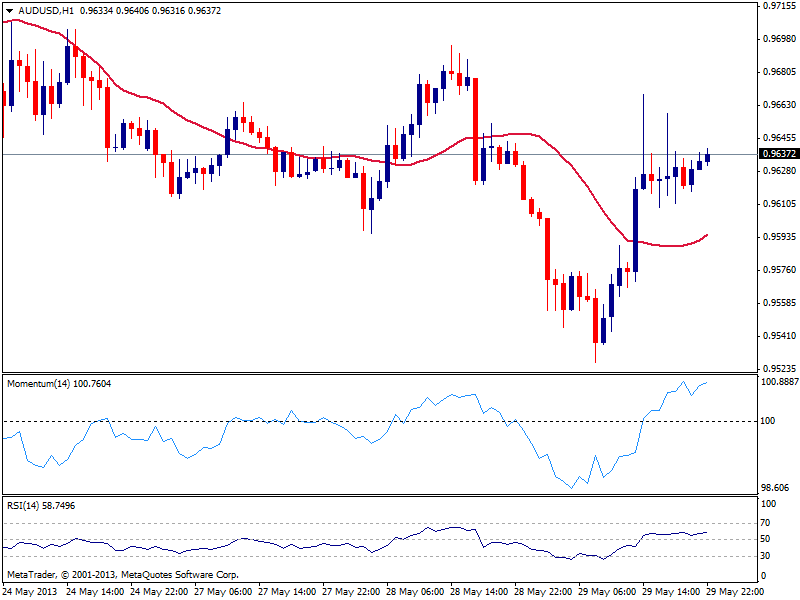
AUD/USD: Current price: 0.9637
View Live Chart for the AUD/USD (select the currency)
Australian dollar posted a fresh low of 0.9527, and despite late recovery, the daily candle continues with the lower low, lower high routine seen over the past few weeks that supports the dominant bearish trend. The hourly chart shows a positive stance ahead of Asian opening, with indicators heading higher in positive territory and price developing above its 20 SMA, although price seems unable to regain the 0.9660 immediate resistance area. In the 4 hours chart, technical picture is still bearish, helping maintain the upside limited.
Support levels: 0.9590 0.9540 0.9500
Resistance levels: 0.9660 0.9700 0.9740
Recommended Content
Editors’ Picks
EUR/USD clings to daily gains above 1.0650

EUR/USD gained traction and turned positive on the day above 1.0650. The improvement seen in risk mood following the earlier flight to safety weighs on the US Dollar ahead of the weekend and helps the pair push higher.
GBP/USD recovers toward 1.2450 after UK Retail Sales data

GBP/USD reversed its direction and advanced to the 1.2450 area after touching a fresh multi-month low below 1.2400 in the Asian session. The positive shift seen in risk mood on easing fears over a deepening Iran-Israel conflict supports the pair.
Gold holds steady at around $2,380 following earlier spike

Gold stabilized near $2,380 after spiking above $2,400 with the immediate reaction to reports of Israel striking Iran. Meanwhile, the pullback seen in the US Treasury bond yields helps XAU/USD hold its ground.
Bitcoin Weekly Forecast: BTC post-halving rally could be partially priced in Premium

Bitcoin price shows no signs of directional bias while it holds above $60,000. The fourth BTC halving is partially priced in, according to Deutsche Bank’s research.
Week ahead – US GDP and BoJ decision on top of next week’s agenda

US GDP, core PCE and PMIs the next tests for the Dollar. Investors await BoJ for guidance about next rate hike. EU and UK PMIs, as well as Australian CPIs also on tap.
