EUR/USD Current price: 1.3282
View Live Chart for the EUR/USD
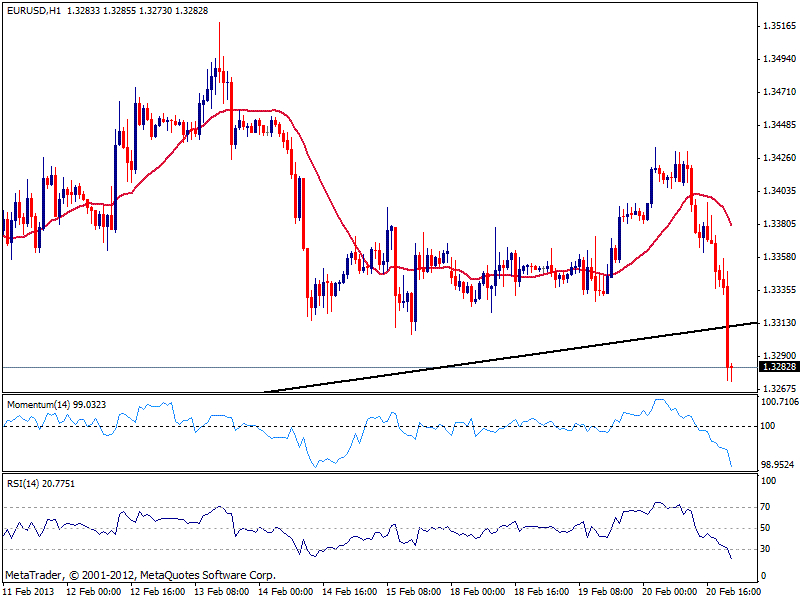
Dollar saw a strong dollar demand after several FED policy makers said the central bank should be ready to vary the pace of their bond purchases. Vary the pace, indeed does not mean actually a reduction, but market understood so. Over the past few months, a minority has been pushing towards ending QE this year, but from their vote, to an actual end, there’s a long way. Gold that had been on a tear since early Europe, fell to $1558/oz, new 2013 low, while stocks in the US post one of the largest daily lost of the year, after hitting a fresh 5-year high. Anyway, dollar skyrocketed across the board, with the EUR/USD breaking below the 1.3300 area, and the daily ascendant trend line coming from 1.2660.
As for the short term, the EUR/USD consolidates near the daily low of 1.3273 with indicators strongly bearish deep in oversold levels. There are no signs the pair may attempt a corrective movement higher, although a pullback towards the broken trend line around 1.3310/20 may take place before sellers reappear. Local share markets will likely be pressured following their overseas partners, adding to dollar strength. There’s a strong static support level around 1.3260, as per early January daily lows. Once below, expect the rally to extend further, with a 100 pips clear path ahead towards 1.3150 price zone.
Support levels: 1.3250 1.3220 1.3180
Resistance levels: 1.3320 1.3350 1.3385
EUR/JPY Current price: 124.24
View Live Chart for the EUR/JPY (select the currency)
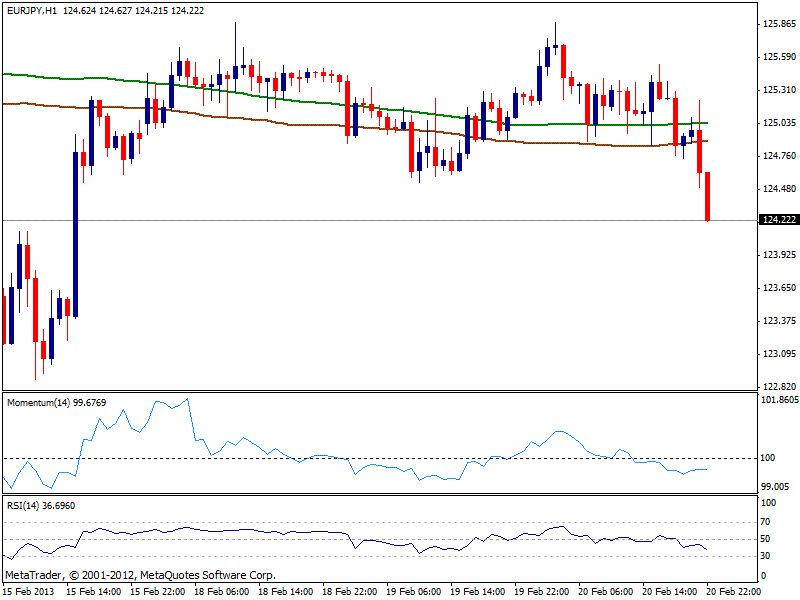
Euro weaker and yen stronger amid uncertainty over next BOJ governor, point for an upcoming EUR/JPY extension, with the pair breaking now below 124.40 support. The hourly chart shows price moving away from 100 and 200 SMA’s, both around 124.90/125.10 now offering resistance, and selling opportunities in case of recoveries. Technical indicators gain bearish tone in negative territory, still far from oversold levels, leaving enough room for more slides. In the 4 hours chart technical readings are also slightly bearish as price advances to fresh weekly lows: 123.80 comes as immediate support now, with possibilities of an extension up to 122.90 for today.
Support levels: 123.80 123.30 122.90
Resistance levels: 124.40 124.85 125.40
GBP/USD Current price: 1.5245
View Live Chart for the GBP/USD (select the currency)
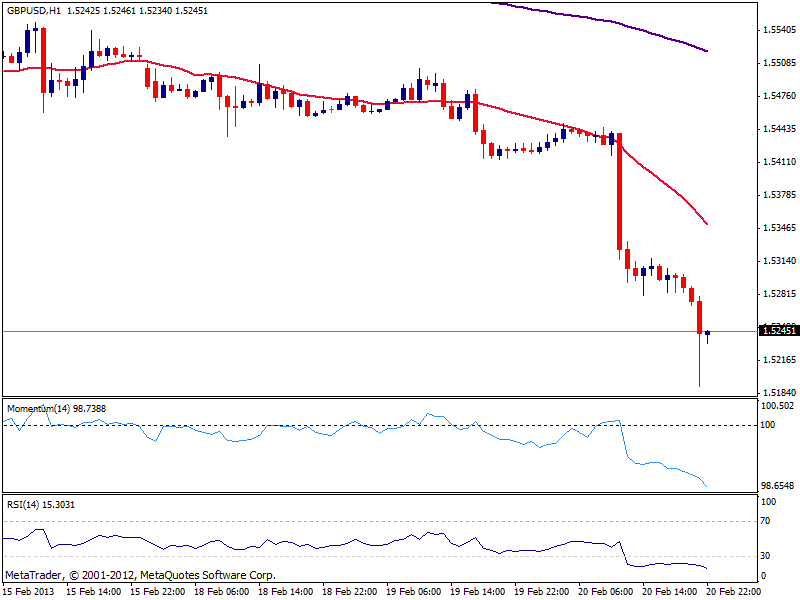
Pound was hammered by BOE Minutes, showing 3 members voted for an extension of QE. After, the news, the GBP/USD fell towards 1.5310 price zone, and never looked back: the pair remained under pressure most of the US session, losing another 130 pips after the FED, and hitting a low of 1.5191 before bouncing back to current levels. As the EUR/USD, the hourly chart shows indicators still heading lower in extreme oversold level, with no signs of changing bias. The 4 hours chart shows a similar picture, supporting a downside continuation in the pair. 2012 yearly low set early January comes at 1.5236, so renewed selling pressure below the level should expose the 1.50 area for the upcoming days.
Support levels: 1.5235 1.5200 1.5170
Resistance levels: 1.5260 1.5310 1.5345
USD/JPY Current price: 93.57
View Live Chart for the USD/JPY (select the currency)
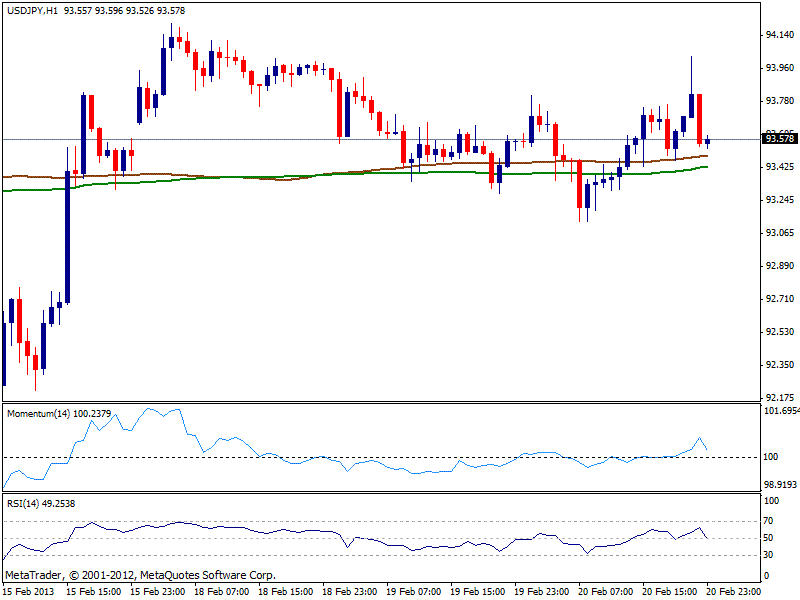
The USD/JPY is finding sellers around 94.00, level reached after US news, falling back towards its daily opening as yen demand increases. Mostly range bound, the hourly chart shows price finding support in a flat 100 SMA, as indicators turn lower in neutral territory, giving no clear clues on short term direction. In the 4 hours chart, technical readings gain bearish tone, with momentum retracing from the 100 level, favoring a retest of recent lows around 93.20. The upside will likely remain limited until next week, when PM Abe will announce the new BOJ governor.
Support levels: 93.50 93.10 92.60
Resistance levels: 93.90 94.15 94.50
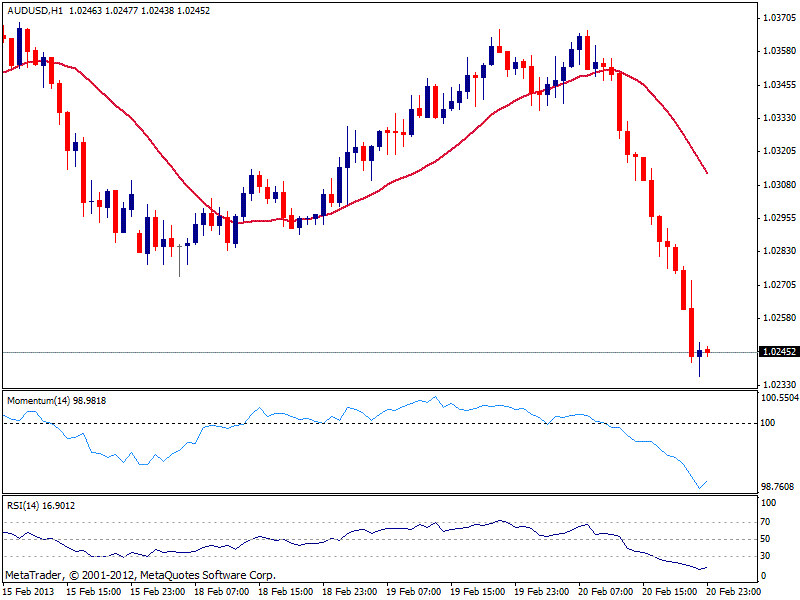
AUD/USD: Current price: 1.0245
View Live Chart for the AUD/USD (select the currency)
Australian dollar followed gold on its fall, reaching against the greenback 1.0236. Extremely oversold in the short term, technical indicators point for an upward corrective movement, although price holds steady near the lows. Buying is not an option even against the trend: approaches to the 1.0270 area if correction actually takes place, should be taken as selling opportunities, as well as an acceleration below 1.0225, past week low.
Support levels: 1.0225 1.0190 1.0160
Resistance levels: 1.0270 1.0300 10330
Recommended Content
Editors’ Picks
EUR/USD regains traction, recovers above 1.0700

EUR/USD regained its traction and turned positive on the day above 1.0700 in the American session. The US Dollar struggles to preserve its strength after the data from the US showed that the economy grew at a softer pace than expected in Q1.
GBP/USD returns to 1.2500 area in volatile session

GBP/USD reversed its direction and recovered to 1.2500 after falling to the 1.2450 area earlier in the day. Although markets remain risk-averse, the US Dollar struggles to find demand following the disappointing GDP data.
Gold climbs above $2,340 following earlier drop

Gold fell below $2,320 in the early American session as US yields shot higher after the data showed a significant increase in the US GDP price deflator in Q1. With safe-haven flows dominating the markets, however, XAU/USD reversed its direction and rose above $2,340.
XRP extends its decline, crypto experts comment on Ripple stablecoin and benefits for XRP Ledger

Ripple extends decline to $0.52 on Thursday, wipes out weekly gains. Crypto expert asks Ripple CTO how the stablecoin will benefit the XRP Ledger and native token XRP.
After the US close, it’s the Tokyo CPI

After the US close, it’s the Tokyo CPI, a reliable indicator of the national number and then the BoJ policy announcement. Tokyo CPI ex food and energy in Japan was a rise to 2.90% in March from 2.50%.
