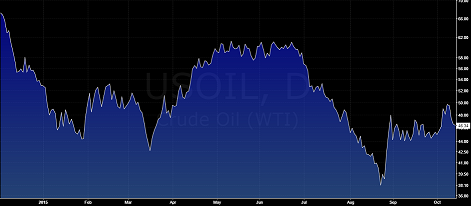
WTI Crude Oil Year-to-date
Crude oil prices seem to have broken out of their range after prices briefly touched the highs of $50 few days ago. The rally in Crude oil came amidst concerns of Russia launching airstrikes against the Syrian rebels. On a fundamental level, Crude oil prices have also gained on a weaker US Dollar which has continued to decline steadily since the jobs report for September showing a weak print in the first week of October. WTI Crude oil prices have so far retraced close to 50% of the declines off June 24th highs at 61.54 and 24th August low of 37.73. Price action has posted a strong reversal off the 50% Fib level near 49.64 and is currently in the midst of posting a 3 day consecutive decline.
In terms of supply and demand, WTI Crude oil prices remain in limbo between slowing demand and continued strong supply dynamics. US shale oil production continues to take a hit amid falling oil prices with expectations that non-OPEC supply will be the first to blink. The EIA, in its report on October 14th noted that production is expected to fall by 93,000 to 5.12 million barrels per day in what could be one of the most pronounced monthly declines since 2007.
Besides the US shale oil producers, other expensive oil producers, especially from Norway expect to see Crude oil production fall by 10% at the very least or about 1.5 million barrels per day by next year.
While it is unlikely that OPEC production could see a cut, the non-OPEC producers remain poised to scale back production, which could be seen as bullish for Crude oil in the medium term.
WTI Crude Oil – Technical Analysis
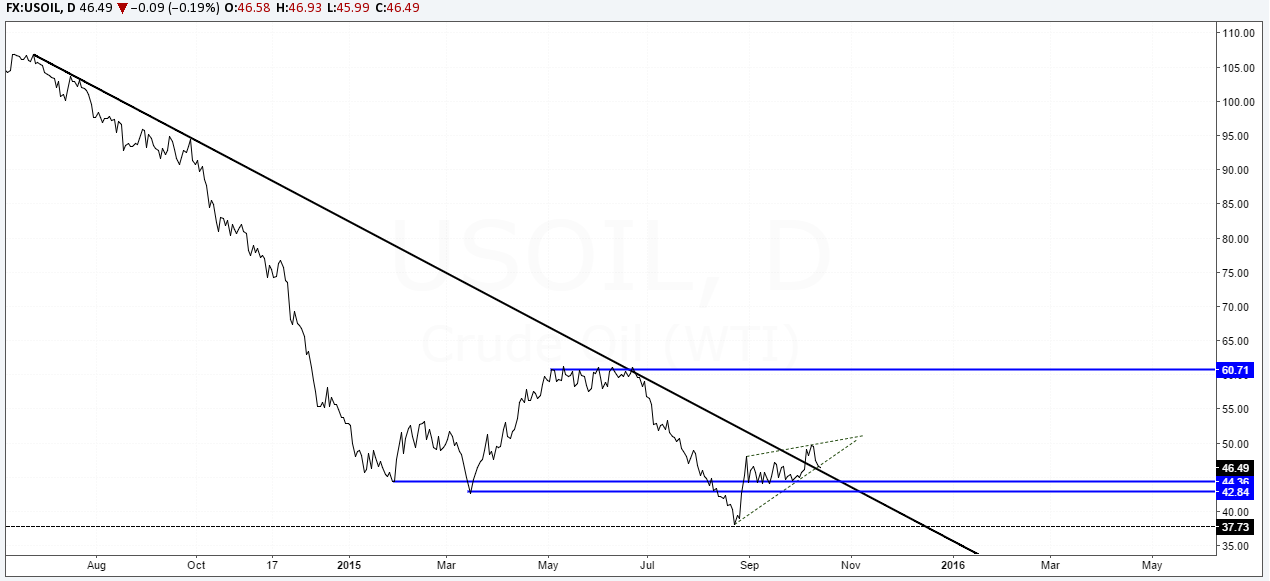
From a technical outlook, there are no clear signs of a rebound in Crude oil prices at the moment with the only exception being the break of the long term trend line connecting the highs from August 2014 through the lows in September this year. Prices are currently heading back lower to retrace the breakout near the $47 handle and looks supported above a clear support zone of 44.36 through 42.84. A test of support at this level is likely to keep Crude oil well supported with the main resistance at 60.71 being the most likely target to the upside.The technical analysis for Crude oil however points to the potential rising wedge pattern which is indicative of an impending move to the downside. Taken in context, Crude oil prices could face strong downside pressure should prices fail to be supported near 44.36 - 42.84. The decline below this support could see a test back to the lows of $37.73.

WTI Crude Oil – Daily Chart (Source: tradingview.com)
Crude Oil – Looking forward
The near term outlook for Crude oil is likely to see prices range sideways with no major strong trends taking place. With most of the declines coming in earlier since 2014, current price action is expect to stabilize within the range of $50 - $30 as the low prices could continue to put pressure on big oil companies in the US and other expensive Crude oil production. Over the longer term, it is very evident that Crude oil prices are likely to pop, which brings to the front the fact that it would be a question of when, rather than if!
The analysis published by XGLOBAL Markets or its representatives should not be considered as solicitation to trade. Any views, opinions or findings are simple market commentary and only for information purposes. Information in our published content should definitely not be taken as investment advice. XGLOBAL Markets or its representatives shall not be held accountable for any incorrect trading decisions or money lost by individuals that decide to follow our market commentary.
Recommended Content
Editors’ Picks
EUR/USD regains traction, recovers above 1.0700

EUR/USD regained its traction and turned positive on the day above 1.0700 in the American session. The US Dollar struggles to preserve its strength after the data from the US showed that the economy grew at a softer pace than expected in Q1.
GBP/USD returns to 1.2500 area in volatile session

GBP/USD reversed its direction and recovered to 1.2500 after falling to the 1.2450 area earlier in the day. Although markets remain risk-averse, the US Dollar struggles to find demand following the disappointing GDP data.
Gold climbs above $2,340 following earlier drop

Gold fell below $2,320 in the early American session as US yields shot higher after the data showed a significant increase in the US GDP price deflator in Q1. With safe-haven flows dominating the markets, however, XAU/USD reversed its direction and rose above $2,340.
XRP extends its decline, crypto experts comment on Ripple stablecoin and benefits for XRP Ledger

Ripple extends decline to $0.52 on Thursday, wipes out weekly gains. Crypto expert asks Ripple CTO how the stablecoin will benefit the XRP Ledger and native token XRP.
After the US close, it’s the Tokyo CPI

After the US close, it’s the Tokyo CPI, a reliable indicator of the national number and then the BoJ policy announcement. Tokyo CPI ex food and energy in Japan was a rise to 2.90% in March from 2.50%.