The Japanese stock market, the Nikkei, looks like it may have completed its bear market yesterday at the 16017 quote which was just over 23% down from the previous high. Let’s take a bottom up approach to the analysis beginning with the daily chart.
NIKKEI DAILY CHART 
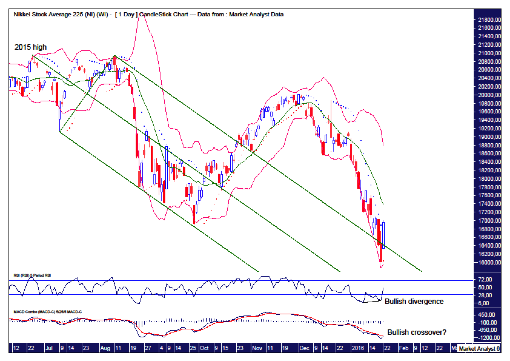
I have drawn an Andrew’s Pitchfork from the 2015 high. This shows a recent pattern of three consecutive lows over the August/September 2015 time period finding support at the lower channel. Price then traded bullishly out of this pitchfork formation before coming right back down and nudging back into the upper channel yesterday. Price looks to have been rejected at this channel support and moved up solidly today.
The PSAR indicator shows price busting the dots on the upside today so a bullish bias is now in force although this is my tight setting and will need some upside follow through.
The Bollinger Bands show price clinging to the lower band on this move down and we still wait for a clear break away from this band to confirm a new upleg has begun.
This low set up a bullish divergence on the RSI while the MACD indicator looks set to show a bullish crossover on another up day.
NIKKEI WEEKLY CHART 
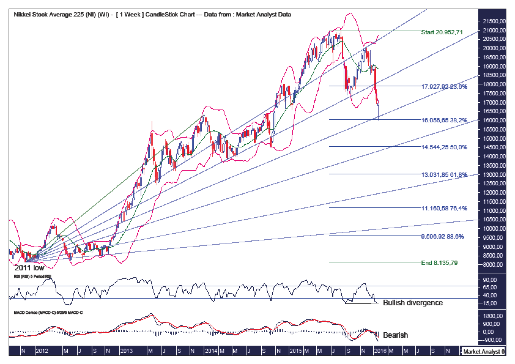
I have drawn a Fibonacci Fan from the 2011 low and it shows the bear market trading down from the top in stair-step fashion with the first low at support from the 38.2% angle before rallying back up and putting in a lower high at resistance from the 23.6% angle. Price subsequently traded to new lows with yesterday’s low bang on support from the 50% angle.
I have added Fibonacci retracement levels from the 2011 low to 2015 high and this low was right around support from the 38.2% level which, assuming this is the final low, keeps the overall bull trend in a strong position.
The Bollinger Bands show this low traded well below the lower band which is a common feature found at solid lows.
The RSI shows a bullish divergence at this low while the MACD indicator is still bearish although the averages have diverged somewhat and price rising from here will fix that.
Let’s wrap things up with the monthly chart.
NIKKEI MONTHLY CHART 
Previously, I was much more bearish about this market but I’m prepared to put that on hold and favour further upside before it all falls apart again.
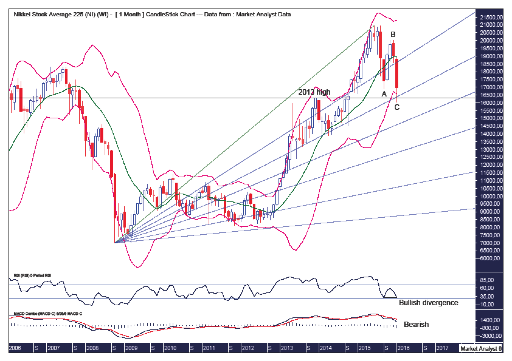
The pattern of trading since last year’s high looks like an ABC corrective formation.
The Bollinger Bands show this wave C low at support from the lower band.
Old tops often provide support in the future and this low is right around support from the 2013 high which is denoted by the horizontal line.
I have drawn a Fibonacci Fan from the 2008 low to 2015 high and this low is at support from the 38.2% angle.
The RSI shows a bullish divergence at this low while the MACD indicator is still bearish so caution still needs to be heeded.
Summing up, the low set yesterday at 16017 was around some good support on all three daily, weekly and monthly charts and I believe that to be the end of the bear market that began in June 2015.
The above is a matter of opinion provided for general information purposes only and is not intended as investment advice. Information and analysis above are derived from sources and utilising methods believed to be reliable, but we cannot accept responsibility for any losses you may incur as a result of this analysis. Individuals should consult with their personal financial advisors. Put simply, it is JUST MY OPINION.
Recommended Content
Editors’ Picks
EUR/USD clings to daily gains above 1.0650

EUR/USD gained traction and turned positive on the day above 1.0650. The improvement seen in risk mood following the earlier flight to safety weighs on the US Dollar ahead of the weekend and helps the pair push higher.
GBP/USD recovers toward 1.2450 after UK Retail Sales data

GBP/USD reversed its direction and advanced to the 1.2450 area after touching a fresh multi-month low below 1.2400 in the Asian session. The positive shift seen in risk mood on easing fears over a deepening Iran-Israel conflict supports the pair.
Gold holds steady at around $2,380 following earlier spike

Gold stabilized near $2,380 after spiking above $2,400 with the immediate reaction to reports of Israel striking Iran. Meanwhile, the pullback seen in the US Treasury bond yields helps XAU/USD hold its ground.
Bitcoin Weekly Forecast: BTC post-halving rally could be partially priced in Premium

Bitcoin price shows no signs of directional bias while it holds above $60,000. The fourth BTC halving is partially priced in, according to Deutsche Bank’s research.
Week ahead – US GDP and BoJ decision on top of next week’s agenda

US GDP, core PCE and PMIs the next tests for the Dollar. Investors await BoJ for guidance about next rate hike. EU and UK PMIs, as well as Australian CPIs also on tap.