The corn price has been hammered over the past couple of years which has meant the winter hiatus this year in the Corn Belt has been a bit gloomy. But if my read on the technicals is correct then some momentary joy is on the way. I expect the price of corn to bob up over the coming months but if I were a farmer in Iowa I would be making hay while the sun shines as I expect these coming higher prices to be fleeting before price once again collapses into final lows.
Let’s investigate the situation taking a bottom up approach to the analysis beginning with the weekly chart.
CORN WEEKLY CHART
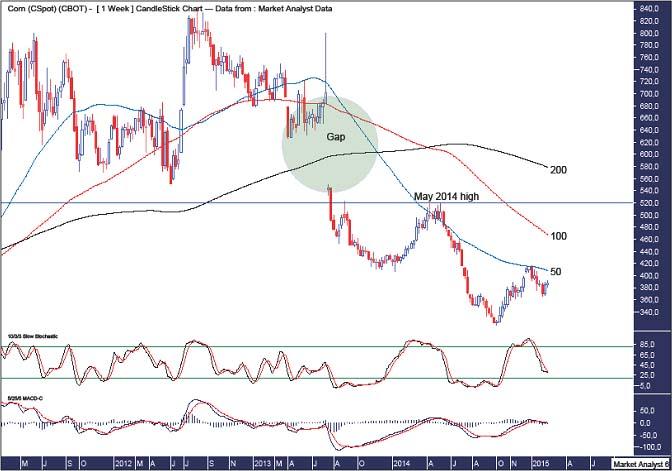
The lower indicators, the Stochastic and Moving Average Convergence (MACD) indicators, both show a bullish divergence on the recent low. The Stochastic indicator looks to be threatening a bullish crossover while the MACD indicator has already turned bullish with the red line above the blue line.
We can see a pattern of lower lows and lower highs signifying a downtrend in force. This is also evidenced by the moving averages I have added with time periods of 50 (blue), 100 (red) and 200 (black). They are ordered as per the downtrend with the 200ma above the 100ma which is in turn above the 50ma.
So, it is probable that any rally now is a bear market rally. And how high is this bear market rally likely to trade?
Price has already found some resistance at the 50ma but I think there is higher to go so the other moving averages may also provide resistance.
There should be some solid resistance at the May 2014 high at US$519.50 and is denoted by the horizontal line. This is the previous swing high and breaking above here would appear bullish.
I have drawn a green highlighted circle which denotes a large gap which is yet another target for any rally. I expect this gap to eventually get filled which requires price to rise up to US$684. It may happen on this current rally or it may happen further down the track when price is in a fully fledged bull trend.
Let’s move on to the monthly chart.
CORN MONTHLY CHART
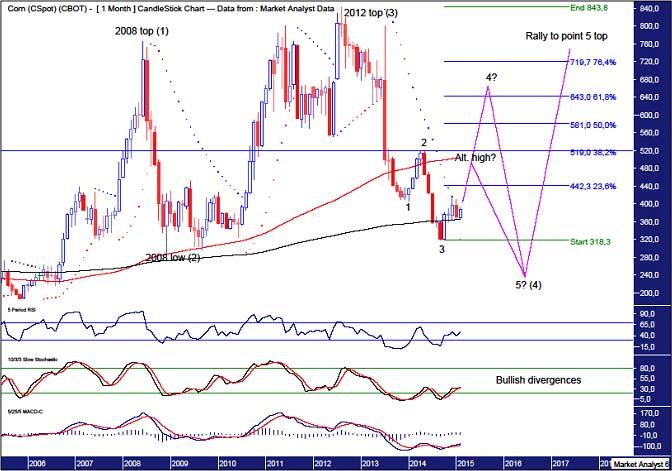
The recent bullish divergence is clear in the lower indicators including the Relative Strength Indicator (RSI), Stochastic and MACD indicators. I expect a decent rally higher from here.
The Parabolic Stop and Reverse (PSAR) indicator shows the dots on the upside being busted a couple of months ago and I expect price to go on with the job here in line with the indicator’s bullish bias.
There are two scenarios I see playing out from here. What are they?
The first scenario is my favoured scenario and involves a large rally taking place which trades above the May 2014 high and looks to close out the gap as shown in the weekly analysis.
I have added Fibonacci retracement levels of the move down from 2012 top to recent low. I am looking for a rally up to around the 61.8% level at US$643 or the 76.4% level at US$719.70.
This scenario would mean a 5 point broadening low formation is playing out. I have labelled the recent highs and lows 1 to 5 with the May 2014 top being point 2 and the recent low being point 3. After the point 4 top is in place the price should come right back down to new lows as it puts in the final point 5 low.
The second scenario is my least favoured scenario although it remains a clear possibility. It involves the rally turning back down failing to make new rally highs above the May 2014 high.
Both scenarios call for new lows below the 2008 low which stands at US$290. I believe a massive 5 point broadening top is in play and price is still tracing itself out on its way to the point 4 low.
We can see the 2008 top was point 1, the 2008 low point 2 and the 2012 top point 3. After the point 4 low is made somewhere south of US$290 price should then explode higher on its way to all time highs above US$843 as it makes its way to the point 5 high.
I have added moving averages with time periods of 100 (red) and 200 (black) as this demonstrates the solid bull trend that is still in force. I expect price dropping to its final lows will see these averages come back together before price surges higher once again.
Let’s now wrap it up by looking at the even bigger picture using the yearly chart.
CORN YEARLY CHART
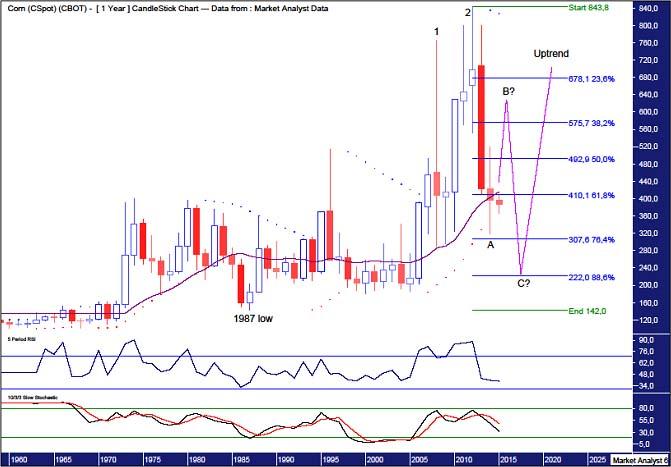
The RSI is trending down and now in weak territory while the Stochastic indicator is also trending down and looking bearish. Not a lot to get excited about here for the bulls.
To my eye, it looks like an ABC correction may be playing out with the wave A low in place and the move up to the wave B high in its infancy. Once price puts in the wave B high I expect a move down to the final wave C low.
Where is the final low likely to be?
I have added Fibonacci retracement levels of the move up from the 1987 low at US$142 to the all time high at US$843. The recent wave A low pulled up just shy of the 76.4% level and I favour the next low to push on further south challenging the 88.6% level at US$222.
The PSAR indicator has a bearish bias after price busted the dots on the downside last year. While price may rally from here I doubt the rally will trade high enough to bust the dots on the upside which currently stand at US$828 and represent resistance.
Also, I have added a 14 period moving average denoted by the purple line and I expect some oscillation around this line before the next bull trend really kicks into gear.
Finally, there appear to be two spike highs already in place denoted by the numbers 1 and 2. A common topping formation consists of three consecutive higher highs which I like to call a “three strikes and you’re out” top. Once the final low is in place I expect price to zoom back up to new all time highs and put in the third and likely final high. But that is a long way off yet.
Summing up, those living in the Midwestern United States may have something to cheer about over the coming months. But according to my view of the technicals, caution should be applied as corn is only on the bob.
The above is a matter of opinion provided for general information purposes only and is not intended as investment advice. Information and analysis above are derived from sources and utilising methods believed to be reliable, but we cannot accept responsibility for any losses you may incur as a result of this analysis. Individuals should consult with their personal financial advisors. Put simply, it is JUST MY OPINION.
Recommended Content
Editors’ Picks
EUR/USD holds above 1.0600 as focus shifts to Powell speech

EUR/USD fluctuates in a narrow range above 1.0600 on Tuesday as the better-than-expected Economic Sentiment data from Germany helps the Euro hold its ground. Fed Chairman Powell will speak on the policy outlook later in the day.
GBP/USD stays near 1.2450 after UK employment data

GBP/USD gains traction and trades near 1.2450 after falling toward 1.2400 earlier in the day. The data from the UK showed that the ILO Unemployment Rate in February rose to 4.2% from 4%, limiting Pound Sterling's upside.
Gold retreats to $2,370 as US yields push higher

Gold stages a correction on Tuesday and fluctuates in negative territory near $2,370 following Monday's upsurge. The benchmark 10-year US Treasury bond yield continues to push higher above 4.6% and makes it difficult for XAU/USD to gain traction.
XRP struggles below $0.50 resistance as SEC vs. Ripple lawsuit likely to enter final pretrial conference

XRP is struggling with resistance at $0.50 as Ripple and the US Securities and Exchange Commission (SEC) are gearing up for the final pretrial conference on Tuesday at a New York court.
Canada CPI Preview: Inflation expected to accelerate in March, snapping two-month downtrend

The Canadian Consumer Price Index is seen gathering some upside traction in March. The BoC deems risks to the inflation outlook to be balanced. The Canadian Dollar navigates five-month lows against the US Dollar.


