![]() Harry S. Dent, MBA
Harry S. Dent, MBA
Dent Research
On Sunday, bitcoin hit new intraday lows of $5,782, falling below the previous lows of $5,968 on February 6.
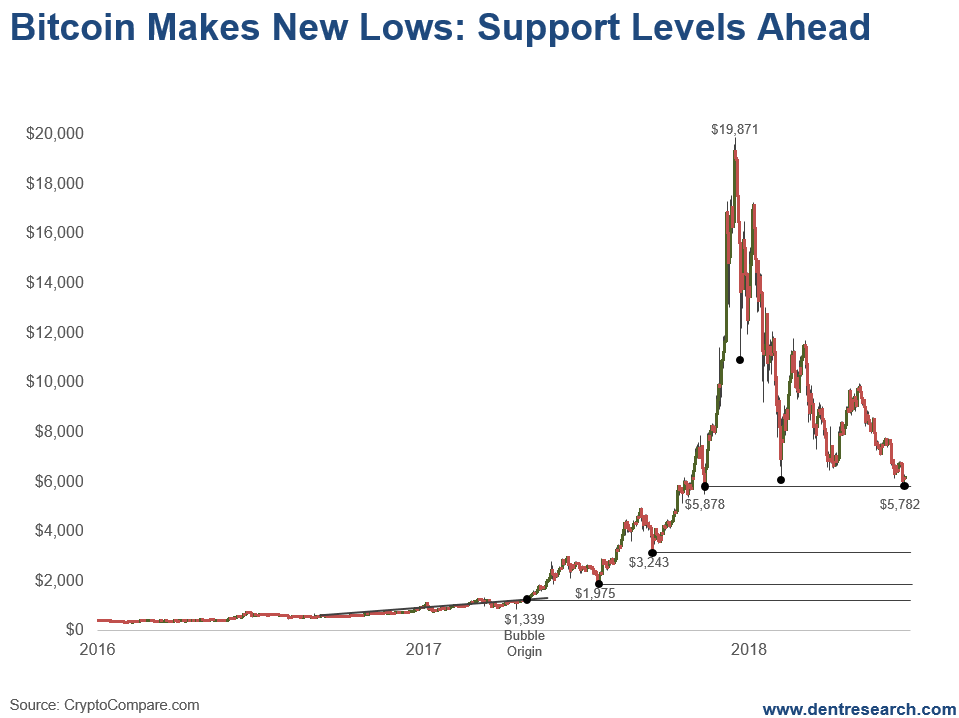
The first crash happened over five days, dropping down to $10,876 (first point after the peak). bitcoin was down 45.3% from the all-time intraday highs of $19,871 on December 17, 2017.
In a more typical five to six-year stock bubble, the first crash averages 42% in 2.6 months. But this bubble was the most extreme in history, even topping the infamous tulip bubble of 1636. It took only 7.7 months to build from its bubble origin of around $1,339 on April 27, 2017 (first point on chart).
That’s a 14.8 times gain!
The first intraday low overall hit just 1.4 months later at $5,968 on February 6, 2018 (second point after the peak).
That was a crash of 70% from the intraday high.
The low on Sunday beat out that low by almost 200 points, and is bouncing today (June 25th) up to over 6,300 so far.
If bitcoin cannot hold near these recent lows of $5,782, it could be ominous in the weeks ahead!
Keep in mind that I’m using intraday numbers for the crash points as that’s what will trigger stops for most traders and investors.
Now, look at the support levels from the bubble on the way up. I quote these on closing numbers, not intraday, as that is more typical for that type of analysis.
The first one is at $5,878 on November 12, 2017. We’re in the process of testing that level. Intraday numbers have already breached that level. If bitcoin closes further below there, it would be more dangerous.
If that’s broken, the next support level would come down around $3,243, the low on September 14, 2017. That would be down 83.2% from the closing all-time high of $19,345.
The next support level comes in at $1,975 on July 15, 2017. That would be a crash of 89.8% from the high… real bubble crash territory…
If it goes that far, it’s likely to go all the way back to the bubble origin of around $1,333 on April 27, 2017, with a 93.1% crash. That’s comparable to the dot-com bubble from 1999 into early 2000 – and the tulip bubble as well.
Frankly, I think there are two likely scenarios:
The first being that bitcoin does hold near the recent lows and support levels of November 2017.
And for the second, the bubble bursts fully and we see a 93%-plus crash.
A clear break below $5,782 favors the second scenario.
While a break up above $7,800 leans towards the first.
If the bubble takes the same time to crash as it did to build, then the lows could be seen around early August.
The dot-com bubble had a similar crash after a very sharp and quick buildup – which went on to see a 16-year bull market, along with another great bubble from early 2009 into 2018 (so far).
This isn’t the end of the broader blockchain technology movement… but it is the end of the first sharp bubble…
The content of our articles is based on what we’ve learned as financial journalists. We do not offer personalized investment advice: you should not base investment decisions solely on what you read here. It’s your money and your responsibility. Our track record is based on hypothetical results and may not reflect the same results as actual trades. Likewise, past performance is no guarantee of future returns. Certain investments such as futures, options, and currency trading carry large potential rewards but also large potential risk. Don’t trade in these markets with money you can’t afford to lose. Delray Publishing LLC expressly forbids its writers from having a financial interest in their own securities or commodities recommendations to readers.
Recommended Content
Editors’ Picks
EUR/USD extends gains above 1.0700, focus on key US data

EUR/USD meets fresh demand and rises toward 1.0750 in the European session on Thursday. Renewed US Dollar weakness offsets the risk-off market environment, supporting the pair ahead of the key US GDP and PCE inflation data.
GBP/USD extends recovery above 1.2500, awaits US GDP data

GBP/USD is catching a fresh bid wave, rising above 1.2500 in European trading on Thursday. The US Dollar resumes its corrective downside, as traders resort to repositioning ahead of the high-impact US advance GDP data for the first quarter.
Gold price edges higher amid weaker USD and softer risk tone, focus remains on US GDP

Gold price (XAU/USD) attracts some dip-buying in the vicinity of the $2,300 mark on Thursday and for now, seems to have snapped a three-day losing streak, though the upside potential seems limited.
XRP extends its decline, crypto experts comment on Ripple stablecoin and benefits for XRP Ledger

Ripple extends decline to $0.52 on Thursday, wipes out weekly gains. Crypto expert asks Ripple CTO how the stablecoin will benefit the XRP Ledger and native token XRP.
US Q1 GDP Preview: Economic growth set to remain firm in, albeit easing from Q4

The United States Gross Domestic Product (GDP) is seen expanding at an annualized rate of 2.5% in Q1. The current resilience of the US economy bolsters the case for a soft landing.